Space Systems Command (SSC) has announced that the next U.S. Space Force mission is scheduled to lift off from Kennedy Space Center’s Launch Complex 39A at 5:55 p.m. ET (22:55 UTC), with a backup opportunity on Sunday, Jan. 15 at 5:56 p.m. ET (22:56 UTC), using SpaceX’s Falcon Heavy rocket.
The mission, formally titled USSF-67, will be the fifth SpaceX Falcon Heavy to date and the heavy-lift vehicle’s second National Security Space Launch (NSSL) mission. It is comprised of two co-manifested satellites used to transmit military communications data and transport payloads to space.
The forward spacecraft, SSC’s Continuous Broadcast Augmenting SATCOM (CBAS)-2, is a satellite destined for geosynchronous orbit to provide communications relay capabilities in support of our senior leaders and combatant commanders. The mission of CBAS-2 is to augment existing military satellite communication capabilities and continuously broadcast military data through space-based satellite relay links.
The second spacecraft, the Long Duration Propulsive ESPA (LDPE)-3A, is used to rapidly place multiple, diverse payloads into orbit and provide critical data to inform and influence future U.S. Space Force programs. This LDPE-3A mission includes two SSC payloads: catcher and WASSAT, and three payloads developed by the Space Rapid Capabilities Office (SRCO). The SRCO payloads include two operational prototypes for enhanced situational awareness, and an operational prototype crypto/interface encryption payload providing secure space-to-ground communications capability. The LDPE spacecraft will continue to provide access to space for multiple DoD space Science & Technology (S&T) demonstration experiments.
“This is a complex mission and truly represents what Assured Access to Space is about and is why we’re so enthusiastic about this upcoming launch…our second Falcon Heavy in just months,” said Maj. Gen. Stephen Purdy, program executive officer for Assured Access to Space. “The teamwork I’ve seen preparing for this launch has just been exceptional. We’ve worked side-by-side with SpaceX to ensure all boxes are checked…that all systems are GO. And our processes for getting to that ‘go’ decision at LRR are thorough and constantly evolve, so they’re also more efficient than ever.”
This Falcon Heavy launch will be the first for the NSSL program this year and the first SpaceX launch from the NSSL Phase 2 contract. NSSL Phase 2 contracts use commercial-like contracts and pricing, saving significant taxpayer dollars while providing stability to the industry base, contributing to more efficient buying practices as well as manifest flexibility that benefits government and commercial customers alike.
A prominent innovation developed by SpaceX and adopted by the U.S. Space Force is booster reusability. The side boosters for USSF-67 were the same ones used for USSF-44, which launched from the Eastern Range on Nov. 1, 2022. The efficiencies garnered from reusability benefit all customers, adding flexibility to a dynamic launch queue and cost savings.
Space Systems Command is the U.S. Space Force’s field command responsible for acquiring and delivering resilient war fighting capabilities to protect our nation’s strategic advantage in and from space. SSC manages an $11 billion space acquisition budget for the Department of Defense and works in partnership with joint forces, industry, government agencies, academic and allied organizations to accelerate innovation and outpace emerging threats. Our actions today are making the world a better space for tomorrow.
Tiny changes on Earth’s surface may precede big disruptions like the 2019 Ridgecrest earthquake that left this rupture in the Mojave Desert in California. NASA scientists are researching data on Earth’s vital signs in search of patterns of motion that could herald a major event. Credit: USGS / Ben Brooks
What can hidden motions underground tell us about earthquakes, eruptions, and even climate change? NASA scientists are using data gathered 400 miles above Earth to find out.
Creeping, rising, falling, slipping – some parts of Earth are in perpetual motion. The movements are usually too tiny for human senses to notice, but they offer clues about more significant changes happening inside volcanoes, along fault lines, and where tectonic plates meet and clash. That’s why scientists at NASA’s Jet Propulsion Laboratory in Southern California are using advanced tools and creative data analyses to find and monitor Earth’s moving surfaces. Here are a few things they’ve learned recently.
Moving Mountains
Geologists once had to go into the field over and over again to collect data on how Earth moves, using technology like GPS and plotting each new measurement on topographic maps. In the 1990s, scientists at JPL and elsewhere developed a new data-processing technique that enabled them to obtain very accurate images using a radar small enough to be mounted on a plane or satellite.
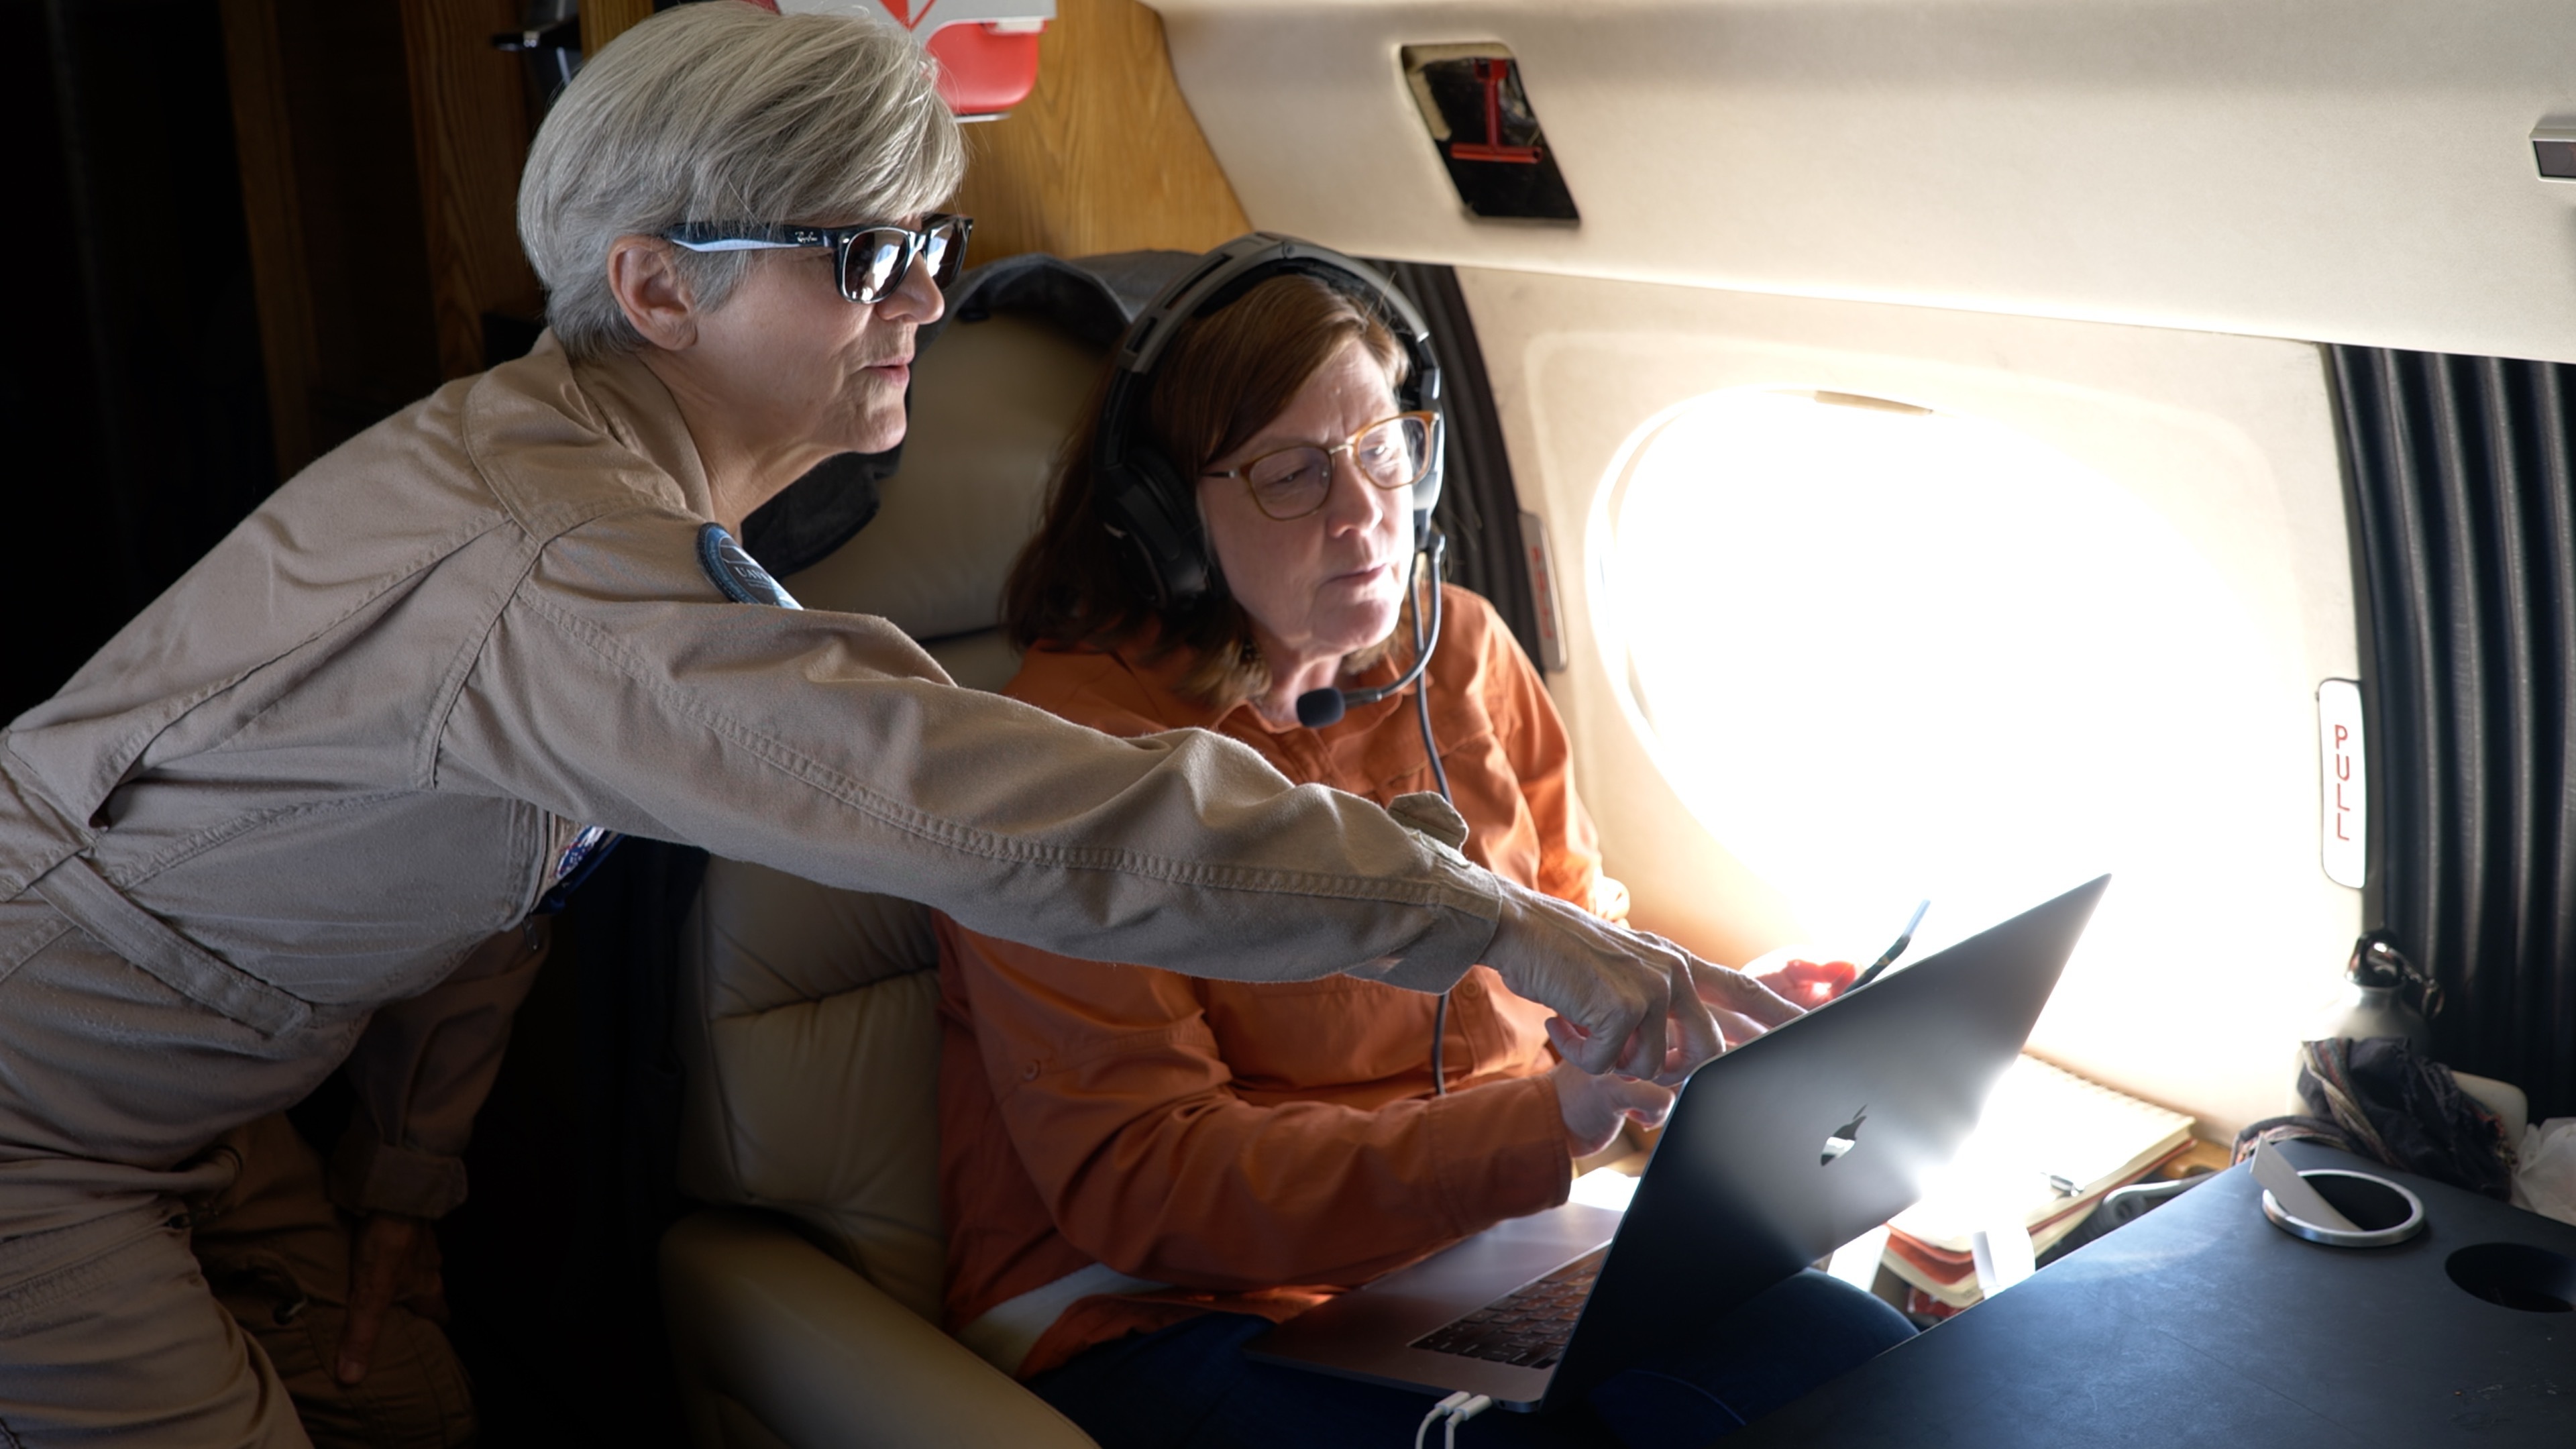
For decades, NASA researchers have been using airborne InSAR data to study a wide range of California hazards – not only faults but groundwater overuse and even oil spills. Here, JPL scientist Cathleen Jones, right, explains incoming data to NASA pilot Elizabeth Ruth during a 2021 research flight. Credit: NASA/JPL-Caltech
As this new data began to accumulate, “it was like you were seeing maps come to life,” said Paul Lundgren, head of JPL’s Earth Surface and Interior group. In some cases, he said, “you could almost intuitively understand the type of mechanism that was causing a volcanic eruption.”
Space agencies worldwide began launching satellite instruments using the new technology – called interferometric synthetic aperture radar or InSAR – and discoveries from this new way of looking at the planet were inevitable. One occurred in 2018 when Chilean authorities asked Lundgren’s group to assess whether a volcano called Nevados de Chillán might be about to erupt. Studying a year’s worth of InSAR images, Lundgren saw no changes in the Chilean peak. But he did notice that another Argentinian volcano named Domuyo was rapidly inflating – a sign of a potential eruption.
Checking earlier data, Lundgren and Társilo Girona (a postdoctoral fellow at JPL at the time who’s now at the University of Alaska, Fairbanks) found that Domuyo had actually deflated between 2008 and 2011. It began inflating in mid-2014, rising about 20 inches (50 centimeters) by the time Lundgren spotted it. Domuyo topped out in 2020 and is now deflating again without having erupted.
After additional analysis of land surface temperature data from NASA’s Moderate Resolution Imaging Spectrometer satellite instruments, Lundgren and Girona concluded that while rising magma causes Domuyo to inflate, gases from the magma can dissipate through the rock, reducing the pressure inside the mountain. The escaping gas occasionally produces a minor explosion on the slopes, but the volcano eventually deflates without pressure building into a major explosion.
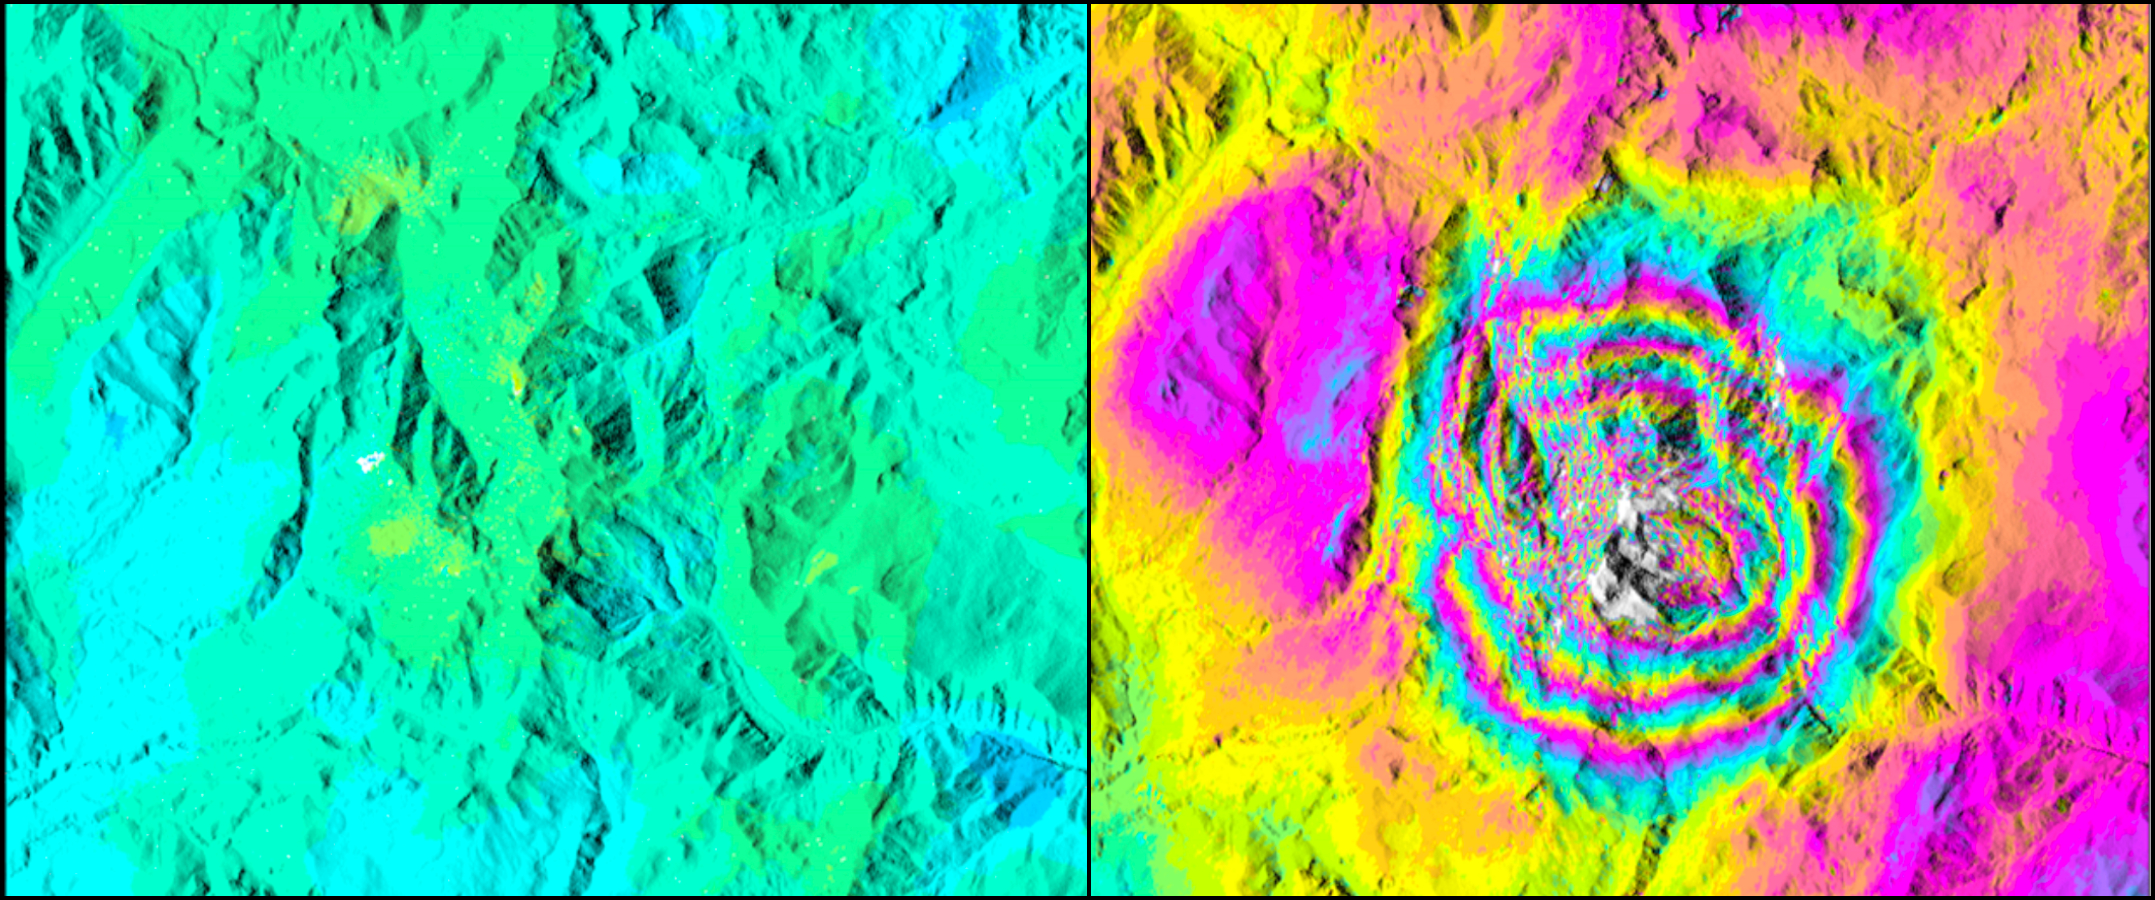
In these interferometric synthetic aperture radar images of the Argentinian volcano Domuyo, each change in color correlates with a change of about 4 inches (10 centimeters) in height. The solid-color image, left, shows Domuyo’s height was stable between 2013 and 2014; the multicolor image shows rapid inflation between 2015 and 2019. Credit: NASA/JPL-Caltech
“Domuyo hasn’t erupted for the past 100,000 years, so this behavior has probably been occurring throughout time,” Lundgren said. “All the same, we need to keep watching it.”
The scientists are searching InSAR satellite data for other volcanos around the world that episodically rise and fall. “There could be behavior that, if you could understand it, you might be able to predict when something is going to erupt,” Lundgren said.
Sticky Faults
Earthquakes occur at places where two sides of a fault line have become stuck together, or locked. As the tectonic plates below the fault continue to move, stress builds on the locked area until the fault rips apart.
However, not all faults are locked. Take the Hayward Fault, considered one of the two most dangerous faults in California. Running 75 miles (120 kilometers) along the east side of San Francisco Bay beneath densely populated land, the fault is now past its average of 150 years between earthquakes.
“The Hayward Fault is unusual,” said JPL scientist Eric Fielding. “Parts of the fault are continuously slipping, a motion we call fault creep.” Creeping faults are less likely to produce large earthquakes because the motion relieves much of the stress. With data collected from dozens of NASA airborne InSAR flights since 2009, Fielding and colleagues are mapping where the Hayward Fault is creeping to better understand how much of it is likely to slip in the next large earthquake. Such information could help planners prepare better.
JPL’s Zhen Liu is using InSAR data, GPS measurements, and numerical models to study a different kind of motion in the earthquake-prone Pacific Northwest, where the Juan de Fuca tectonic plate is diving offshore under the North American plate. The small Juan de Fuca plate snags the land above it and drags the coastline eastward for about 14 months at a time. Eventually, the stress becomes too great, and for two weeks the land slowly slips back westward.
Regularly repeating slow-slip events like this have also been observed in New Zealand and elsewhere. When these patterns change, Liu noted, “there’s increasing evidence that slow-slip events may be harbingers of large earthquakes.” In a recent study with Yingdi Luo of Caltech, Liu suggested that the 14-month cycle in the Northwest may speed up before the next big earthquake.
Fielding and Liu look forward to the 2024 launch of the NASA-Indian Space Research Organization Synthetic Aperture Radar (NISAR) mission, which will deliver a trove of new InSAR data. NISAR will observe every location on Earth every 12 days – better coverage than existing satellites – increasing the chances of spotting unusual land motions and improving early warning capabilities.
Canadian Uplift
Reducing risks from natural hazards isn’t the only motive for studying the movement of Earth’s surface. Scientists also want to understand how natural processes interact with human-induced climate change.
An example of this is how the bending and straightening of the North American tectonic plate is affecting sea levels from Florida to the Arctic. During the last ice age, ice sheets several miles thick accumulated on the northern half of the North American tectonic plate, squashing it down into the mantle below (30 to 50 miles, or 50 to 80 kilometers, down). The surface of modern Canada sank as mantle material flowed out from under the extra weight, and much of the modern United States rose as that displaced material flowed in.
Although it has been 8,000 years since the ice sheets melted, the mantle beneath North America is still recovering from the pressure. Returning mantle material has been lifting the Canadian land mass higher above the ocean – high enough to outpace global sea level rise. But the northward flow of mantle material has been causing the eastern and southern coasts of the U.S. to sink, compounding the risks from sea level rise that has accompanied global climate change.
To understand the course of future sea level rise, we need to know more about this natural process: How long will it continue? How much farther will the rebounding mantle move? Scientists are developing computer models of solid Earth processes to help answer such questions. Recently, JPL scientist Donald Argus has been using data from the NASA-German Gravity Recovery and Climate Experiment (GRACE) satellites and from GPS and sea level measurements to start assessing the stickiness (viscosity) of the mantle, which affects the rate of surface recovery. “We depend on GRACE for estimates of snow and ice loss and to understand sea level rise, but you have to get the model right,” Argus said.
New Data Provides Insights Into an Early Era of Star Formation
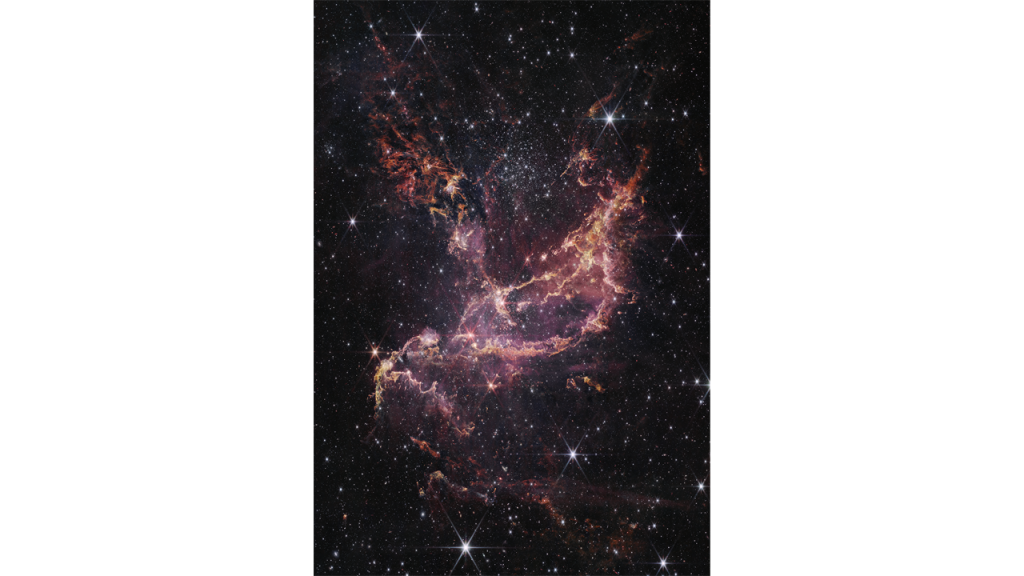
By peering into a well-known star cluster within the Small Magellanic Cloud, Webb’s NIRCam instrument has revealed many new pockets of star formation that have never been seen. Further, new structures appear in this image that provide a window into the stars feeding within.
NGC 346, one of the most dynamic star-forming regions in nearby galaxies, is full of mystery. Now, it is less mysterious with new findings from NASA’s James Webb Space Telescope.
NCG 346 is located in the Small Magellanic Cloud (SMC), a dwarf galaxy close to our Milky Way. The SMC contains lower concentrations of elements heavier than hydrogen or helium, which astronomers call metals, compared to the Milky Way. Since dust grains in space are composed mostly of metals, scientists expected there would be low amounts of dust, and that it would be hard to detect. New data from Webb reveals the opposite.
Astronomers probed this region because the conditions and amount of metals within the SMC resemble those seen in galaxies billions of years ago, during an era in the universe known as “cosmic noon,” when star formation was at its peak. Some 2 to 3 billion years after the big bang, galaxies were forming stars at a furious rate. The fireworks of star formation happening then still shape the galaxies we see around us today.
“A galaxy during cosmic noon wouldn’t have one NGC 346 like the Small Magellanic Cloud does; it would have thousands” of star-forming regions like this one, said Margaret Meixner, an astronomer at the Universities Space Research Association and principal investigator of the research team. “But even if NGC 346 is now the one and only massive cluster furiously forming stars in its galaxy, it offers us a great opportunity to probe conditions that were in place at cosmic noon.”
By observing protostars still in the process of forming, researchers can learn if the star formation process in the SMC is different from what we observe in our own Milky Way. Previous infrared studies of NGC 346 have focused on protostars heavier than about 5 to 8 times the mass of our Sun. “With Webb, we can probe down to lighter-weight protostars, as small as one tenth of our Sun, to see if their formation process is affected by the lower metal content,” said Olivia Jones of the United Kingdom Astronomy Technology Centre, Royal Observatory Edinburgh, a co-investigator on the program.
As stars form, they gather gas and dust, which can look like ribbons in Webb imagery, from the surrounding molecular cloud. The material collects into an accretion disk that feeds the central protostar. Astronomers have detected gas around protostars within NGC 346, but Webb’s near-infrared observations mark the first time they have also detected dust in these disks.
“We’re seeing the building blocks, not only of stars, but also potentially of planets,” said Guido De Marchi of the European Space Agency, a co-investigator on the research team. “And since the Small Magellanic Cloud has a similar environment to galaxies during cosmic noon, it’s possible that rocky planets could have formed earlier in the universe than we might have thought.”
The team also has spectroscopic observations from Webb’s NIRSpec instrument that they are continuing to analyze. These data are expected to provide new insights into the material accreting onto individual protostars, as well as the environment immediately surrounding the protostar.
These results are being presented Jan. 11 in a press conference at the 241st meeting of the American Astronomical Society. The observations were obtained as part of program 1227.
The James Webb Space Telescope is the world’s premier space science observatory. Webb will solve mysteries in our solar system, look beyond to distant worlds around other stars, and probe the mysterious structures and origins of our universe and our place in it. Webb is an international program led by NASA with its partners, ESA (European Space Agency) and the Canadian Space Agency.
MEDIA CONTACT:
Matthew Brown Space Telescope Science Institute, Baltimore, Maryland
Christine Pulliam Space Telescope Science Institute, Baltimore, Maryland
Astronomers studying archival observations of powerful explosions called short gamma-ray bursts (GRBs) have detected light patterns indicating the brief existence of a superheavy neutron star shortly before it collapsed into a black hole. This fleeting, massive object likely formed from the collision of two neutron stars.
“We looked for these signals in 700 short GRBs detected with NASA’s Neil Gehrels Swift Observatory, Fermi Gamma-ray Space Telescope, and the Compton Gamma Ray Observatory,” explained Cecilia Chirenti, a researcher at the University of Maryland, College Park (UMCP) and NASA’s Goddard Space Flight Center in Greenbelt, Maryland, who presented the findings at the 241st meeting of the American Astronomical Society in Seattle. “We found these gamma-ray patterns in two bursts observed by Compton in the early 1990s.”
A paper describing the results, led by Chirenti, was published Monday, Jan. 9, in the scientific journal Nature.
A neutron star forms when the core of a massive star runs out of fuel and collapses. This produces a shock wave that blows away the rest of the star in a supernova explosion. Neutron stars typically pack more mass than our Sun into a ball about the size of a city, but above a certain mass, they must collapse into black holes.
Both the Compton data and computer simulations revealed mega neutron stars tipping the scales by 20% more than the most massive, precisely measured neutron star known – dubbed J0740+6620 – which weighs in at nearly 2.1 times the Sun’s mass. Superheavy neutron stars also have nearly twice the size of a typical neutron star, or about twice the length of Manhattan Island.
The mega neutron stars spin nearly 78,000 times a minute – almost twice the speed of J1748–2446ad, the fastest pulsar on record. This rapid rotation briefly supports the objects against further collapse, allowing them to exist for just a few tenths of a second, after which they proceed to form a black hole faster than the blink of an eye.
“We know that short GRBs form when orbiting neutron stars crash together, and we know they eventually collapse into a black hole, but the precise sequence of events is not well understood,” said Cole Miller, a professor of astronomy at UMCP and a co-author of the paper. “At some point, the nascent black hole erupts with a jet of fast-moving particles that emits an intense flash of gamma rays, the highest-energy form of light, and we want to learn more about how that develops.”
This simulation tracks the gravitational wave and density changes as two orbiting neutron stars crash together. Dark purple colors represent the lowest densities, while yellow-white shows the highest. An audible tone and a visual frequency scale (at left) track the steady rise in the frequency of gravitational waves as the neutron stars close. When the objects merge at 42 seconds, the gravitational waves suddenly jump to frequencies of thousands of hertz and bounce between two primary tones (quasiperiodic oscillations, or QPOs). The presence of these signals in such simulations led to the search and discovery of similar phenomena in the light emitted by short gamma-ray bursts. Credits: NASA’s Goddard Space Flight Center and STAG Research Centre/Peter Hammond
Short GRBs typically shine for less than two seconds yet unleash energy comparable to what’s released by all the stars in our galaxy over one year. They can be detected more than a billion light-years away. Merging neutron stars also produce gravitational waves, ripples in space-time that can be detected by a growing number of ground-based observatories.
Computer simulations of these mergers show that gravitational waves exhibit a sudden jump in frequency – exceeding 1,000 hertz – as the neutron stars coalesce. These signals are too fast and faint for existing gravitational wave observatories to detect. But Chirenti and her team reasoned that similar signals could appear in the gamma-ray emission from short GRBs.
Astronomers call these signals quasiperiodic oscillations, or QPOs for short. Unlike, say, the steady ringing of a tuning fork, QPOs can be composed of several close frequencies that vary or dissipate over time. Both the gamma-ray and gravitational wave QPOs originate in the maelstrom of swirling matter as the two neutron stars coalesce.
While no gamma-ray QPOs materialized in the Swift and Fermi bursts, two short GRBs recorded by Compton’s Burst And Transient Source Experiment (BATSE) on July 11, 1991, and Nov. 1, 1993, fit the bill.
The larger area of the BATSE instrument gave it the upper hand in finding these faint patterns – the tell-tale flickering that revealed the presence of mega neutron stars. The team rates the combined odds of these signals occurring by chance alone at less than 1 in 3 million.
“These results are very important as they set the stage for future measurements of hypermassive neutron stars by gravitational wave observatories,” said Chryssa Kouveliotou, chair of the physics department at George Washington University in Washington, who was not involved in the work.
By the 2030s, gravitational wave detectors will be sensitive to kilohertz frequencies, providing new insights into the short lives of supersized neutron stars. Until then, sensitive gamma-ray observations and computer simulations remain the only available tools for exploring them.
Compton’s BATSE instrument was developed at NASA’s Marshall Space Flight Center in Huntsville, Alabama, and provided the first compelling evidence that gamma-ray bursts occurred far beyond our galaxy. After operating for almost nine years, the Compton Gamma Ray Observatory was deorbited on June 4, 2000, and destroyed as it entered Earth’s atmosphere.
Goddard manages both the Swift and Fermi missions.
Banner: Merging neutron stars, illustrated here, produce a blast of gamma rays when they come together and collapse into a black hole. Observations of two bursts by NASA’s Compton mission indicate that before their final collapse, the objects briefly form a single supersized neutron star. Credit: NASA’s Goddard Space Flight Center/CI Lab
Based on new evidence from the NASA/ESA/CSA James Webb Space Telescope, this illustration shows the exoplanet LHS 475 b. It is rocky and almost precisely the same size as Earth. The planet whips around its star in just two days, far faster than any planet in the Solar System. Researchers will follow up this summer with additional observations with Webb, which they hope will allow them to definitively conclude if the planet has an atmosphere. LHS 475 b is relatively close, 41 light-years away, in the constellation Octans. [Image Description: Illustration of a planet on a black background. The planet is large and rocky. Roughly two-thirds of the planet is lit, while the rest is in shadow.]
Researchers have confirmed the presence of an exoplanet, a planet that orbits another star, using the NASA/ESA/CSA James Webb Space Telescope for the first time. Formally classified as LHS 475 b, the planet is almost exactly the same size as our own, clocking in at 99% of Earth’s diameter.
The research team is led by Kevin Stevenson and Jacob Lustig-Yaeger, both of the Johns Hopkins University Applied Physics Laboratory in Laurel, Maryland. The team chose to observe this target with Webb after carefully reviewing data from NASA’s Transiting Exoplanet Survey Satellite (TESS) which hinted at the planet’s existence. Webb’s Near-Infrared Spectrograph (NIRSpec) captured the planet easily and clearly with only two transit observations. “There is no question that the planet is there. Webb’s pristine data validate it,” said Lustig-Yaeger. “The fact that it is also a small, rocky planet is impressive for the observatory,” Stevenson added.
“These first observational results from an Earth-sized, rocky planet open the door to many future possibilities for studying rocky planet atmospheres with Webb,” agreed Mark Clampin, Astrophysics Division director at NASA Headquarters in Washington. “Webb is bringing us closer and closer to a new understanding of Earth-like worlds outside the Solar System, and the mission is only just getting started.”
How do researchers spot a distant planet? By observing the changes in light as it orbits its star. A light curve from the NASA/ESA/CSA James Webb Space Telescope’s Near-Infrared Spectrograph (NIRSpec) shows the change in brightness from the LHS 475 star system over time as the planet transited the star on 31 August 2022. LHS 475 b is a rocky, Earth-sized exoplanet that orbits a red dwarf star roughly 41 light-years away, in the constellation Octans. The planet is extremely close to its star, completing one orbit in two Earth-days. Confirmation of the presence of the planet was made possible by Webb’s data. [Image Description: The graphic shows the change in relative brightness of the star-planet system spanning three hours. The spectrum shows that the brightness of the system remains steady until the planet begins to transit the star. It then decreases, representing when the planet is directly in front of the star. The brightness increases again when the planet is no longer blocking the star, at which point it levels out.]
Among all operating telescopes, only Webb is capable of characterising the atmospheres of Earth-sized exoplanets. The team attempted to assess what is in the planet’s atmosphere by analysing its transmission spectrum. Although the data show that this is an Earth-sized terrestrial planet, they do not yet know if it has an atmosphere. “The observatory’s data are beautiful,” said Erin May, also of the Johns Hopkins University Applied Physics Laboratory. “The telescope is so sensitive that it can easily detect a range of molecules, but we can’t yet draw any definitive conclusions about the planet’s atmosphere.”
Although the team can’t conclude what is present, they can definitely say what is not present. “There are some terrestrial-type atmospheres that we can rule out,” explained Lustig-Yaeger. “It can’t have a thick methane-dominated atmosphere, similar to that of Saturn’s moon Titan.”
The team also notes that while it’s possible the planet has no atmosphere, there are some atmospheric compositions that have not been ruled out, such as a pure carbon dioxide atmosphere. “Counterintuitively, a 100% carbon dioxide atmosphere is so much more compact that it becomes very challenging to detect,” said Lustig-Yaeger. Even more precise measurements are required for the team to distinguish a pure carbon dioxide atmosphere from no atmosphere at all. The researchers are scheduled to obtain additional spectra with further observations this summer.
A flat line in a transmission spectrum, like this one, can be exciting — it can tell us a lot about the planet. Researchers used the NASA/ESA/CSA James Webb Space Telescope’s Near-Infrared Spectrograph (NIRSpec) to observe exoplanet LHS 475 b on 31 August 2022. As this spectrum shows, Webb did not observe a detectable quantity of any element or molecule. The data (white dots) are consistent with a featureless spectrum representative of a planet that has no atmosphere (yellow line). The purple line represents a pure carbon dioxide atmosphere and is indistinguishable from a flat line at the current level of precision. The green line represents a pure methane atmosphere, which is not favoured since methane, if present, would be expected to block more starlight at 3.3 microns. [Image Description: The graphic shows the transmission spectrum of the rocky exoplanet LHS 475 b. The data points are plotted as white circles with grey error bars on a graph of the amount of light blocked in percent on the vertical axis versus wavelength of light in microns on the horizontal axis. A straight green line represents a best-fit model. A curvy red line represents a methane model, and a slightly less curvy purple line represents a carbon dioxide model.]
Webb also revealed that the planet is a few hundred degrees warmer than Earth, so if clouds are detected it may lead the researchers to conclude that the planet is more like Venus, which has a carbon dioxide atmosphere and is perpetually shrouded in thick cloud. “We’re at the forefront of studying small, rocky exoplanets,” Lustig-Yaeger said. “We have barely begun scratching the surface of what their atmospheres might be like.”
The researchers also confirmed that the planet completes an orbit in just two days, information that was almost instantaneously revealed by Webb’s precise light curve. Although LHS 475 b is closer to its star than any planet in the Solar System, its red dwarf star is less than half the temperature of the Sun, so the researchers project it still could support an atmosphere.
The researchers’ findings have opened up the possibility of pinpointing Earth-sized planets orbiting smaller red dwarf stars. “This rocky planet confirmation highlights the precision of the mission’s instruments,” Stevenson said. “And it is only the first of many discoveries that it will make.” Lustig-Yaeger agreed: “With this telescope, rocky exoplanets are the new frontier.”
LHS 475 b is relatively close, at only 41 light-years away, in the constellation Octans.
The team’s results were presented at a press conference of the American Astronomical Society (AAS) on Wednesday 11 January, 2023.
More information
Webb is the largest, most powerful telescope ever launched into space. Under an international collaboration agreement, ESA provided the telescope’s launch service, using the Ariane 5 launch vehicle. Working with partners, ESA was responsible for the development and qualification of Ariane 5 adaptations for the Webb mission and for the procurement of the launch service by Arianespace. ESA also provided the workhorse spectrograph NIRSpec and 50% of the mid-infrared instrument MIRI, which was designed and built by a consortium of nationally funded European Institutes (The MIRI European Consortium) in partnership with JPL and the University of Arizona.
Webb is an international partnership between NASA, ESA and the Canadian Space Agency (CSA).
The largest and brightest region of star formation in the Local Group of galaxies, including the Milky Way, is called 30 Doradus (or, informally, the Tarantula Nebula).
Located in the Large Magellanic Cloud, a small neighbor galaxy to the Milky Way, 30 Doradus has long been studied by astronomers who want to better understand how stars like the Sun are born and evolve.
NASA’s Chandra X-ray Observatory has frequently looked at 30 Doradus over the lifetime of the mission, often under the direction of Dr. Leisa Townsley who passed away in the summer of 2022. These data will continue to be collected and analyzed, providing opportunities for scientists both now and in the future to learn more about star formation and its related processes.
This new composite image combines the X-ray data from Chandra observations of 30 Doradus with an infrared image from NASA’s James Webb Space Telescope that was released in the fall of 2022. The X-rays (royal blue and purple) reveal gas that has been heated to millions of degrees by shock waves — similar to sonic booms from airplanes — generated by the winds from massive stars. The Chandra data also identify the remains of supernova explosions, which will ultimately send important elements such as oxygen and carbon into space where they will become part of the next generation of stars.
The infrared data from JWST (red, orange, green, and light blue) show spectacular canvases of cooler gas that provide the raw ingredients for future stars. JWST’s view also reveals “protostars,” that is, stars in their infancy, just igniting their stellar engines. The chemical composition of 30 Doradus is different from most of the nebulas found in the Milky Way. Instead it represents the conditions in our galaxy that existed several billion years ago when stars were forming at a much faster pace than astronomers see today. This, combined with its relative proximity and brightness, means that 30 Doradus provides scientists with an opportunity to learn more about how stars formed in our galaxy in the distant past.
NASA’s Marshall Space Flight Center manages the Chandra program. The Smithsonian Astrophysical Observatory’s Chandra X-ray Center controls science operations from Cambridge, Massachusetts, and flight operations from Burlington, Massachusetts.
The James Webb Space Telescope is the world’s premier space science observatory. Webb will solve mysteries in our solar system, look beyond to distant worlds around other stars, and probe the mysterious structures and origins of our universe and our place in it. Webb is an international program led by NASA with its partners, ESA (European Space Agency) and the Canadian Space Agency.
Image credit: X-ray: NASA/CXC/Penn State Univ./L. Townsley et al.; IR: NASA/ESA/CSA/STScI/JWST ERO Production Team
Mission terminated after reaching space but prior to achieving orbit as a result of premature shutdown of first burn of second stage
Prior to Start Me Up mission, every customer satellite launched by Virgin Orbit had reached its desired orbit
Virgin Orbit has begun an internal investigation into root causes
Pending satisfactory conclusion of failure investigation and completion of corrective actions and mission assurance processes, Virgin Orbit plans its next launch from Mojave
Discussions have begun for anticipated future return to Spaceport Cornwall
LONG BEACH, CA — 12 JANUARY 2023— Preliminary analysis of data from the Start Me Up mission has begun to shed light on the outcome of the January 9th flight and next steps to follow.
Mission Recap
The Start Me Up mission was the first orbital launch attempt in history conducted from western Europe. The flight was conducted by Virgin Orbit’s air-launched LauncherOne system from the newly commissioned Spaceport Cornwall in the UK, which just a few weeks ago was transformed from a mere slab of empty cement at a commercial airport into the world’s newest space launch operations center.
After successfully proceeding through pre-launch operations and taking off as planned from the runway at Spaceport Cornwall, Virgin Orbit’s carrier aircraft traveled to the bespoke drop zone selected for this mission and successfully released the rocket.
The rocket then ignited its first stage engine, quickly going hypersonic and successfully completing the stage one burn. Initial data assessments indicate that the first stage of the rocket performed as expected, that the rocket reached space altitudes, and that stage separation, ignition of the upper stage, and fairing separation similarly occurred per the planned mission timeline.
Later in the mission, at an altitude of approximately 180 km, the upper stage experienced an anomaly. This anomaly prematurely ended the first burn of the upper stage. This event ended the mission, with the rocket components and payload falling back to Earth within the approved safety corridor without ever achieving orbit.
Virgin Orbit’s carrier aircraft and its crew returned safely to Spaceport Cornwall.
Update on the Investigation and Next Steps
Extensive telemetry coverage for the flight allowed for the collection of an enormous quantity of data during the mission, allowing Virgin Orbit’s engineers and review board members to start their analysis immediately upon detection of the anomaly.
Virgin Orbit has initiated a formal investigation into the source of the second stage failure, to be led by Jim Sponnick (Co-Investigator), a distinguished aerospace veteran who was instrumental in the development and operations of the Atlas II, III and V launch systems and operations of the Delta II and IV launch systems and Chad Foerster (Principal Investigator), Virgin Orbit’s Chief Engineer and Vice President of Technology Development. An extensive fault analysis and investigation and completion of all required corrective actions identified during the investigation will be completed prior to the next flight.
Virgin Orbit is continuing to process its next scheduled rocket through final integration and checkout ahead of its upcoming mission, which is planned to occur from the Mojave Air and Space Port in California.
Virgin Orbit also anticipates returning to Spaceport Cornwall for additional launches, and is in active discussions with key government and commercial stakeholders in the UK to start planning mission opportunities for as soon as later this year.
Dan Hart, CEO of Virgin Orbit, said: “We are all disappointed that we were not able to achieve full mission success and provide the launch service that our customers deserve. Upon identifying the anomaly, our team immediately moved into a pre-planned investigation mode. Given our four previous successful missions, which have proven our technology, our team’s deep understanding of the LauncherOne system from massive amounts of previously collected flight data, and the ample telemetry data that was collected characterizing the flight and the anomaly, I am confident that root cause and corrective actions will be determined in an efficient and timely manner. We are continuing to process and test our next vehicle per our plan and will implement any required modifications prior to our next launch.
“I also want to express my heartfelt appreciation to our team, who worked tirelessly under high pressure and difficult conditions, and most importantly to our customers, supporters, and partners in the UK, the US, and across the world. We thank you for the many expressions of confidence and support we have received over the past two days.”
NASA astronaut and Expedition 68 Flight Engineer Nicole Mann peers through one of the seven windows in the cupola, the International Space Station’s “window to the world” on Jan. 2, 2023. Mann displays the U.S. flag inside the cupola in the window next to her.
The cupola is designed for watching operations outside the station such as robotic activities, the approach of vehicles, and spacewalks. Its windows provide spectacular views of Earth and celestial objects.
Newly discovered Earth-size planet TOI 700 e orbits within the habitable zone of its star in this illustration. Its Earth-size sibling, TOI 700 d, can be seen in the distance. Credit: NASA/JPL-Caltech/Robert Hurt
The newly discovered planet and its Earth-size sibling are both in the habitable zone, where liquid water could potentially exist on their surfaces.
Using data from NASA’s Transiting Exoplanet Survey Satellite, scientists have identified an Earth-size world, called TOI 700 e, orbiting within the habitable zone of its star – the range of distances where liquid water could occur on a planet’s surface. The world is 95% Earth’s size and likely rocky.
Astronomers previously discovered three planets in this system, called TOI 700 b, c, and d. Planet d also orbits in the habitable zone. But scientists needed an additional year of TESS observations to discover TOI 700 e.
“This is one of only a few systems with multiple, small, habitable-zone planets that we know of,” said Emily Gilbert, a postdoctoral fellow at NASA’s Jet Propulsion Laboratory in Southern California who led the work. “That makes the TOI 700 system an exciting prospect for additional follow-up. Planet e is about 10% smaller than planet d, so the system also shows how additional TESS observations help us find smaller and smaller worlds.”
Gilbert presented the result on behalf of her team at the 241st meeting of the American Astronomical Society in Seattle. A paper about the newly discovered planet was accepted by The Astrophysical Journal Letters.
Watch to learn about TOI 700 e, a newly discovered Earth-size planet with an Earth-size sibling. Credit: Credits: NASA/JPL-Caltech/Robert Hurt/NASA’s Goddard Space Flight Center
TOI 700 is a small, cool M dwarf star located around 100 light-years away in the southern constellation Dorado. In 2020, Gilbert and others announced the discovery of the Earth-size, habitable-zone planet d, which is on a 37-day orbit, along with two other worlds.
The innermost planet, TOI 700 b, is about 90% Earth’s size and orbits the star every 10 days. TOI 700 c is over 2.5 times bigger than Earth and completes an orbit every 16 days. The planets are probably tidally locked, which means they spin only once per orbit such that one side always faces the star, just as one side of the Moon is always turned toward Earth.
TESS monitors large swaths of the sky, called sectors, for approximately 27 days at a time. These long stares allow the satellite to track changes in stellar brightness caused by a planet crossing in front of its star from our perspective, an event called a transit. The mission used this strategy to observe the southern sky starting in 2018, before turning to the northern sky. In 2020, it returned to the southern sky for additional observations. The extra year of data allowed the team to refine the original planet sizes, which are about 10% smaller than initial calculations.
“If the star was a little closer or the planet a little bigger, we might have been able to spot TOI 700 e in the first year of TESS data,” said Ben Hord, a doctoral candidate at the University of Maryland, College Park and a graduate researcher at NASA’s Goddard Space Flight Center in Greenbelt, Maryland. “But the signal was so faint that we needed the additional year of transit observations to identify it.”
TOI 700 e, which may also be tidally locked, takes 28 days to orbit its star, placing planet e between planets c and d in the so-called optimistic habitable zone.
Scientists define the optimistic habitable zone as the range of distances from a star where liquid surface water could be present at some point in a planet’s history. This area extends to either side of the conservative habitable zone, the range where researchers hypothesize liquid water could exist over most of the planet’s lifetime. TOI 700 d orbits in this region.
Finding other systems with Earth-size worlds in this region helps planetary scientists learn more about the history of our own solar system.
Follow-up study of the TOI 700 system with space- and ground-based observatories is ongoing, Gilbert said, and may yield further insights into this rare system.
“TESS just completed its second year of northern sky observations,” said Allison Youngblood, a research astrophysicist and the TESS deputy project scientist at Goddard. “We’re looking forward to the other exciting discoveries hidden in the mission’s treasure trove of data.”
More About the Mission
TESS is a NASA Astrophysics Explorer mission led and operated by Massachusetts Institute of Technology in Cambridge, Massachusetts, and managed by NASA’s Goddard Space Flight Center. Additional partners include Northrop Grumman, based in Falls Church, Virginia; NASA’s Ames Research Center in California’s Silicon Valley; the Center for Astrophysics | Harvard & Smithsonian in Cambridge, Massachusetts; MIT’s Lincoln Laboratory; and the Space Telescope Science Institute in Baltimore. More than a dozen universities, research institutes, and observatories worldwide are participants in the mission.
An annotated version of the opening image, the arrow indicates a boulder track. Faint horizontal lines are camera artifacts that will eventually be removed once we have obtained a robust inflight calibration dataset. Image is 2040 meters wide, ShadowCam M012728826 [NASA/KARI/Arizona State University].
In December 2022, the Korean Aerospace Research Institute (KARI) successfully placed the Korean Pathfinder Lunar Orbiter (KPLO, also known as Danuri) satellite into lunar orbit. KPLO carries six instruments, one of them being the NASA-funded ShadowCam.
Designed and built by Malin Space Science Systems (MSSS), ShadowCam is a younger sibling of the successful Lunar Reconnaissance Orbiter Camera (LROC), Narrow Angle Camera (NAC). ShadowCam adds to our knowledge of the Moon by imaging within permanently shadowed regions near the poles. Since the lunar spin axis is only tilted 1.5 degrees, the Moon barely has seasons. The poles are in a perpetual state of dawn to dusk, with the Sun always on the horizon. As a result, depressions near the poles never receive direct solar illumination, areas known as permanently shadowed regions or PSRs.
LROC has imaged nearly all of the Moon at meter scale, except within PSRs. The LROC Narrow Angle Camera design was modified so that ShadowCam is 200x more sensitive than the NAC to image within PSRs, taking advantage of light dimly reflected from nearby topography. For film photography, this would be the equivalent of increasing from ISO 100 to greater than 12,800 without increasing grain.
What does it look like where the Sun never shines? Well, now we know – in at least one place! This portion of the interior of Shackleton crater does not immediately look different than normally illuminated craters found elsewhere on the Moon. The upper twenty percent of the image shows the base of the steep wall, and the rest of the image is of the hummocky crater floor. Track (arrow, image below) shows the path of a 5-meter diameter boulder that rolled down the steeply sloping crater wall and came to rest on the floor. Boulder tracks are commonly found elsewhere on the Moon.
Due to its relatively small size, the temperature of much of the portion of Shackleton crater shown here rises above the water ice stability point temperature (110 K or -261 degrees Fahrenheit) in summer. Therefore, this area is not the most likely host for frost or ice at the surface. Perhaps elsewhere in this crater where temperatures are lower, there might be ice or frost waiting to be seen!
Shackleton crater makes for a fun first test of ShadowCam because it was also the first portion of the Moon imaged by LROC. That first LROC image showed the illuminated rim of Shackleton but none of the interior. In this image, ShadowCam reveals the interior but none of the rim because the detector is so sensitive that it saturates whenever viewing terrain directly illuminated by sunlight.
As the KPLO mission progresses, ShadowCam will be imaging all of the lunar permanently shadowed regions with pixel scales better than 2 meters, searching for frost and ice, looking for any changes with time or season, assessing the geomorphology of this frigid terrain, and mapping out the terrain for future surface exploration by missions such as the NASA Volatiles Investigating Polar Exploration Rover, also known as VIPER.


