The Planetary Society and the Planetary Defense Conference are proud to present a special screening of the IMAX original film “Asteroid Hunters” in Vienna, Austria on Wednesday, 5 April. The Planetary Society’s Senior Communications Adviser and Planetary Radio creator Mat Kaplan will host a Q&A with an international group of scientists and planetary defense experts after the screening.
About “Asteroid Hunters”
Meet asteroid scientists and discover the cutting-edge tools and techniques they use to detect and track asteroids, and the technology that may one day protect our planet. The effects of an asteroid impact could be catastrophic and while the current probability of an event in our lifetime is low, the potential consequences make the study of asteroids an incredibly important area of scientific research. Witness the latest in planetary defense and how science, ingenuity, and determination combine to explore the world’s most preventable natural disaster. Narrated by Daisy Ridley.
Speakers include
Bill Ailor, Aerospace Corporation technical fellow
Mark Boslough, research professor and airburst specialist at the University of New Mexico
Marina Brozovic, physicist at NASA’s Jet Propulsion Laboratory
Ian Carnelli, project manager of ESA’s Hera mission
Paul Chodas, manager of NASA’s Center for Near-Earth Object Studies (CNEOS)
Kelly Fast, program manager for NASA’s Near-Earth Object Observations Program
Event date: Wednesday, 5 April
Time: 20:15 until 22:30 CEST
Price: Free
Location: Cineplexx Donau Zentrum 13 IMAX
Wagramerstraße 79 Westfield Donau Zentrum, 1220 Wien, Austria
Seating is limited, and reservations are required.
An orbital sunrise reveals cloud tops above the Pacific Ocean northeast of New Zealand as the International Space Station orbited 260 miles above on Feb. 10, 2023. Astronauts aboard the space station see 16 sunrises and sunsets per day due to their high orbital velocity—17,500 miles per hour. In the more than 20 years that people have been living aboard, the station has circumnavigated Earth tens of thousands of times.
Dark clouds roil the sky above Pasadena, California, during an atmospheric river event. A series of nine such storms delivered record amounts of rain and snow to the state and caused multiple deaths between late 2022 and January 2023. Additional atmospheric rivers have inundated California since. Credit: NASA/JPL-Caltech
Like hurricane categories, a scale for atmospheric river storm severity could help communities around the globe compare and prepare.
Atmospheric rivers – vast airborne corridors of water vapor flowing from Earth’s tropics toward higher latitudes – can steer much-needed rain to parched lands. But in extreme form, they can also cause destruction and loss of life, as recently occurred in parts of California. Their effects, both hazardous and beneficial, are felt globally.
A new study using NASA data shows that a recently developed rating system can provide a consistent global benchmark for tracking these “rivers in the sky.” Research into atmospheric rivers has largely focused on the west coasts of North America and Europe. The new findings help expand our understanding of how these storms arise, evolve, and impact communities all over the world. In addition, the ratings could help meteorologists better warn people to plan for them.
NASA’s Atmospheric Infrared Sounder (AIRS) aboard the Aqua satellite captured a series of atmospheric rivers that impacted much of Western North America in early 2023, as seen in this animation showing cloud temperatures. Cooler clouds – shown in blue and purple – are associated with very heavy rainfall. Credit: NASA/JPL-Caltech
The findings also revealed an increasing number of atmospheric river events around the world and across all ranks, with peak activity in mid-latitude oceans (temperate belts roughly between 30 and 60 degrees north and south).
To help forecast the potential strength and impacts of the storms as they make landfall on the West Coast of North America, meteorologists from the Scripps Institution of Oceanography at the University of California, San Diego, along with the National Weather Service, introduced an atmospheric river (AR) scale in 2019. By ranking them from 1 to 5, or weakest to strongest, the scientists sought to differentiate between primarily beneficial storms versus primarily hazardous ones. By one estimate, insured losses due to flood damages increase by a factor of 10 with every step up in rank, with AR 5 events linked to a median damage amount of $260 million in the Western U.S.
Shaping the Water Cycle
Although the term “atmospheric river” was only coined in 1994, the storms’ impacts were felt well before then. Scientists have estimated some 300 million people worldwide are at risk for flooding due to atmospheric rivers which, on average, transport quantities of water vapor more than double the flow of the Amazon River. A growing body of research is exploring how these storms play a critical role in shaping the global water cycle from the Andes to the Arctic, where moisture from atmospheric rivers has recently been found to melt and slow the seasonal recovery of sea ice.
An atmospheric river system that traveled across the Pacific Ocean in 2017 is captured here in satellite imagery by NASA’s AIRS instrument. Scientists are working to understand how these powerful storms impact regions of the world beyond western North America and Europe. Credit: NASA/JPL-Caltech
In the new study, scientists built a database of global atmospheric river events from 1980 to 2020, using a computer algorithm to automatically identify tens of thousands of the events in the Modern-Era Retrospective analysis for Research and Applications, version 2 (MERRA-2), a NASA re-analysis of historical atmospheric observations. To rank the events, the study authors then applied the atmospheric river scale, which is based on a storm’s expected duration and maximum rate of water vapor transport.
Across the 40 years studied, higher-ranked storms lasted longer and traveled farther than lower-ranked storms. Mean travel distance was found to be about 400 miles (650 kilometers) with AR 1 and about 2,900 miles (4,700 kilometers) with AR 5, while mean lifetime was about 17 hours for AR 1 and 110 hours for AR 5. Higher-ranked storms (AR 4 and AR 5) were less common and tended to begin their life cycle closer to the tropics while ending in colder, higher-latitude regions.
Additionally, the scientists detected an increase in atmospheric river frequency during strong El Niño years.
Diagnosing a Storm
“The current study helps to highlight the global reach of atmospheric rivers, as well as their possible origins, including in less-explored regions where the environmental conditions and societal impacts could be different from where we currently live [in the United States],” said lead author Bin Guan, a scientist at the Joint Institute for Regional Earth System Science and Engineering (JIFRESSE). The institute is a collaboration between University of California, Los Angeles and NASA’s Jet Propulsion Laboratory in Southern California.
A uniform scale can be useful for diagnosing atmospheric rivers in an era of instant communications, the scientists said. A key advantage is that the ratings minimize possible confusion when comparing the same meteorological phenomenon across languages and cultures. They noted this has not been the case for some more familiar weather events, such as tropical cyclones, which have been categorized using different thresholds in different regions.
Guan and colleagues said that taking the next step and translating the scale into region-specific impacts will require more research that takes into consideration local characteristics. They noted that many factors, from geography to socioeconomics, can influence how a storm is perceived by those who weather it.
Wolf-Rayet stars are a rare prelude to the famous final act of massive stars: the supernova. In one of its first observations, NASA’s James Webb Space Telescope captured the Wolf-Rayet star WR 124 in unprecedented detail. A distinctive halo of gas and dust frames the star and glows in the infrared light detected by Webb, displaying knotty structure and a history of episodic ejections. Despite being the scene of an impending stellar “death,” astronomers also look to Wolf-Rayet stars for insight into new beginnings. Cosmic dust is forming in the turbulent nebulas surrounding these types of stars, which is composed of the heavy-element building blocks of the modern universe, including life on Earth.
The rare sight of a Wolf-Rayet star – among the most luminous, most massive, and most briefly-detectable stars known – was one of the first observations made by NASA’s James Webb Space Telescope in June 2022. Webb shows the star, WR 124, in unprecedented detail with its powerful infrared instruments. The star is 15,000 light-years away in the constellation Sagitta.
Massive stars race through their lifecycles, and only some of them go through a brief Wolf-Rayet phase before going supernova, making Webb’s detailed observations of this rare phase valuable to astronomers. Wolf-Rayet stars are in the process of casting off their outer layers, resulting in their characteristic halos of gas and dust. The star WR 124 is 30 times the mass of the Sun and has shed 10 Suns’ worth of material—so far. As the ejected gas moves away from the star and cools, cosmic dust forms and glows in the infrared light detectable by Webb.
The origin of cosmic dust that can survive a supernova blast and contribute to the universe’s overall “dust budget” is of great interest to astronomers for multiple reasons. Dust is integral to the workings of the universe: It shelters forming stars, gathers together to help form planets, and serves as a platform for molecules to form and clump together—including the building blocks of life on Earth. Despite the many essential roles that dust plays, there is still more dust in the universe than astronomers’ current dust-formation theories can explain. The universe is operating with a dust budget surplus.
Webb opens up new possibilities for studying details in cosmic dust, which is best observed in infrared wavelengths of light. Webb’s Near-Infrared Camera (NIRCam) balances the brightness of WR 124’s stellar core and the knotty details in the fainter surrounding gas. The telescope’s Mid-Infrared Instrument (MIRI) reveals the clumpy structure of the gas and dust nebula of the ejected material now surrounding the star. Before Webb, dust-loving astronomers simply did not have enough detailed information to explore questions of dust production in environments like WR 124, and whether the dust grains were large and bountiful enough to survive the supernova and become a significant contribution to the overall dust budget. Now those questions can be investigated with real data.
Stars like WR 124 also serve as an analog to help astronomers understand a crucial period in the early history of the universe. Similar dying stars first seeded the young universe with heavy elements forged in their cores – elements that are now common in the current era, including on Earth.
Webb’s detailed image of WR 124 preserves forever a brief, turbulent time of transformation, and promises future discoveries that will reveal the long-shrouded mysteries of cosmic dust.
The James Webb Space Telescope is the world’s premier space science observatory. Webb will solve mysteries in our solar system, look beyond to distant worlds around other stars, and probe the mysterious structures and origins of our universe and our place in it. Webb is an international program led by NASA with its partners, ESA (European Space Agency), and CSA (Canadian Space Agency).
Credits
MEDIA CONTACT:
Leah Ramsay Space Telescope Science Institute, Baltimore, Maryland
Christine Pulliam Space Telescope Science Institute, Baltimore, Maryland
Students at NASA’s Jet Propulsion Laboratory pose for photos around the laboratory wearing their eclipse glasses. Credits: NASA
NASA is awarding more than $3.8 million to 21 museums, science centers, and other informal education institutions for projects designed to bring the excitement of space science to communities across the nation and broaden student participation in STEM (science, technology, engineering, and mathematics).
Projects were selected for NASA’s Teams Engaging Affiliated Museums and Informal Institutions (TEAM II) program and TEAM II Community Anchor Awards. Both are funded through NASA’s Next Generation STEM (Next Gen STEM), which supports kindergarten to 12-grade students, caregivers, and formal and informal educators in engaging the Artemis Generation in the agency’s missions and discoveries. The selected projects will engage their communities in a wide variety of STEM topics, from aeronautics and Earth science to human space exploration.
TEAM II: NASA-Based Learning Opportunities
NASA’s vision for TEAM II is to enhance the capability of informal education institutions to host NASA-based learning activities while increasing the institutions’ capacity to use innovative tools and platforms to bring NASA resources to students. The agency has selected four institutions to receive approximately $3.2 million in cooperative agreements for projects they will implement during the next three years.
The selected institutions and their proposed projects are:
Universities Space Research Association, Columbia, Maryland Virtual Trips to Extreme Environments
Michigan Science Center, Detroit, Michigan Urban Skies – Equitable Universe: Using Open Space to Empower Youth to Explore Their Solar System and Beyond
Museum of Science, Boston, Massachusetts UNITED (Unveiling NASA’s Inspirational Tales of Exploration and Discovery)
University Corporation for Atmospheric Research, Boulder, Colorado Using a Network of Ozone Bioindicator Gardens to Engage Communities on Air Quality and NASA’s TEMPO Mission
Community Anchors: Local Connections to NASA
The designation as a Community Anchor recognizes institutions as local hubs bringing NASA STEM and space science to students and families in traditionally underserved areas. The agency has selected 17 institutions to receive more than $660,000 in grants to help make these one- to two-year projects a reality, enhancing the local impact and strengthening their ability to build sustainable connections between their communities and NASA.
The selected institutions and their proposed projects are:
St. Anna’s Episcopal Church, New Orleans, Louisiana Communicating Our Future For Education Expansion (COFFEE)
Frontiers of Flight Museum, Inc., Dallas, Texas Youth STEM Initiative – STEM Leaders in Education
Children’s Museum of Indianapolis, Inc., Indianapolis, Indiana Our Earth From Above
Pacific Science Center Foundation, Seattle, Washington Connecting Youth to the Journey of Human Space Flight
National Space Science & Technology Institute, Colorado Springs, Colorado Mobile Earth + Space Observatory Science Experiences for Engaging Rural Students
Board of Regents of the University of Nebraska, Lincoln, Nebraska Because I’m Earth it: A NebrASkA Experience
Pajarito Environmental Education Center, Los Alamos, New Mexico Exploring STEM Opportunities from New Mexico to the Solar System
Scienceworks Hands-On Museum, Ashland, Oregon ScienceWorks Robotics in Space Program
City of Manhattan, Kansas Flying Cleaner and Faster: Connecting Kansas Kids to the Future of Aviation
Northern Kentucky University, Highland Heights, Kentucky Afterschool NASA Production Club
Utah State University, Logan, Utah 4-H Moon to Mars Tetrathlon
New York Hall of Science, Queens, New York Connecting Communities to Real Time Astronomy Phenomena: Solar Eclipse 2024
Monterey Institute for Research In Astronomy, Marina, California MIRA la Luna: Igniting Interest in STEM for Middle School Students of the Salinas Valley
Infinity Science Center, Inc., Pearlington, Mississippi Outreach STEM Education: Bringing NASA STEM Education to local communities through local county library systems and INFINITY Science Center
Sierra Nevada Journeys, Reno, Nevada NASA Family STEM Nights
Union Station Kansas City, Inc., Kansas City, Missouri Union Station Kansas City Inc NASA Team II Proposal
Eugene Science Center Inc., Eugene, Oregon Sky’s The Limit: Access to Portable Planetarium Experiences for Rural and Title I Schools to Address Disparity in STEM Proficiency
Next Gen STEM is a project within NASA’s Office of STEM Engagement, which develops unique resources and experiences to spark student interest in STEM and build a skilled and diverse next generation workforce. For the latest NASA STEM events, activities, and news, visit:
Scientists have, for the first time, discovered possible signs of active volcanism on Venus.
The findings confirm long-held suspicions that the planet, which is 80% covered in volcanic rock and the scars of past volcanic eruptions, is still active today.
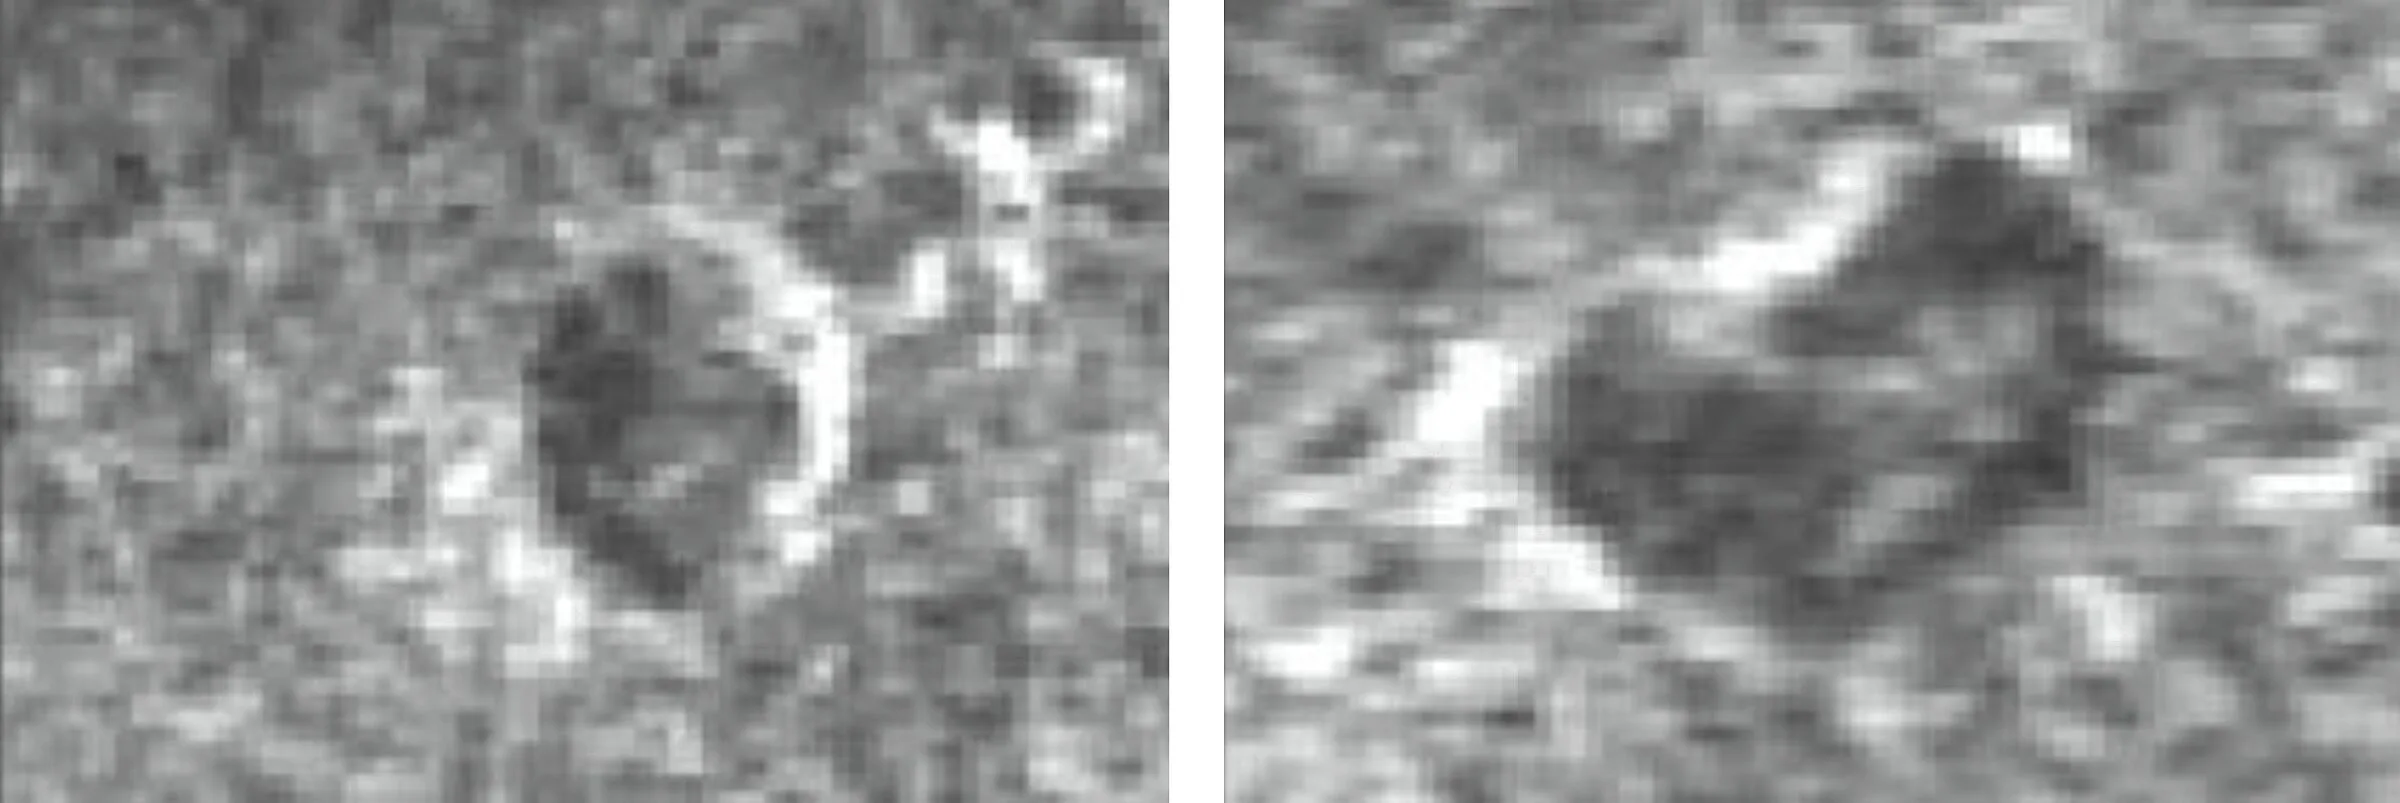
The evidence comes from data collected by NASA’s Magellan spacecraft, which orbited Venus from 1990 to 1994. In two grainy 1991 radar images captured eight months apart, a volcanic vent morphs from a circular depression into a larger, kidney-bean shape, which researchers interpret as indicating volcanic activity at work.
The discovery, which was published in the journal Science, provides an important data point for scientists trying to piece together why Venus, a twin to our own planet, morphed from a potentially habitable world into a stifling hellscape.
“There’s a lot of big-picture scenarios about how Venus has evolved over the last billion or two billion years,” said Robert Herrick, the paper’s lead author and a research professor at the University of Alaska Fairbanks Geophysical Institute. “An important boundary condition on those visions is how much activity is occurring today, what the nature of the geologic activity is that’s occurring today, and where it’s occurring today. This paper is sort of the first step in really nailing that down.”
Similar volcanic activity is likely to be detected by NASA’s upcoming VERITAS mission — a spiritual successor to Magellan that would map the entire planet in even greater detail and overlapping coverage.
Sue Smrekar, the VERITAS principal investigator who was not involved in the discovery, said the images of a volcanic event were “extremely convincing” that Venus is active.
“There’s all kinds of reasons to think that Venus should be active,” she said. “It is such a thrill to finally see proof, which also adds fuel to other lines of evidence for activity.”
CHANGING VOLCANIC VENT ON VENUS These two images from NASA’s Magellan spacecraft, captured eight months apart in 1991, show a volcanic vent on Venus that has changed size and shape. In the left image, captured in February, the vent has a surface area of 2.2 square kilometers (0.8 square miles). In the right image, captured in October, the vent has a surface area of 4.0 square kilometers (1.5 square miles).Image: Images from Herrick & Hensley (2023)
A needle in a haystack
Herrick’s work with Venus data dates back to his time as a grad student and then postdoc, when NASA was distributing Magellan imagery on CD-ROMs.
Most desktop computers were not powerful enough to load large, high-resolution radar images, forcing researchers to explore the Venusian surface one small slice at a time.
Equipped with modern technology and a little extra time thanks to the pandemic, Herrick went looking for changes that happened between overlapping Magellan radar passes. He likened it to “looking for a needle in a haystack, with no guarantee that there’s a needle.”
To slim down the haystack, he focused on promising locations for volcanic activity. Unfortunately, much of Magellan’s overlapping radar coverage was at different viewing angles, making it much harder to look for changes.
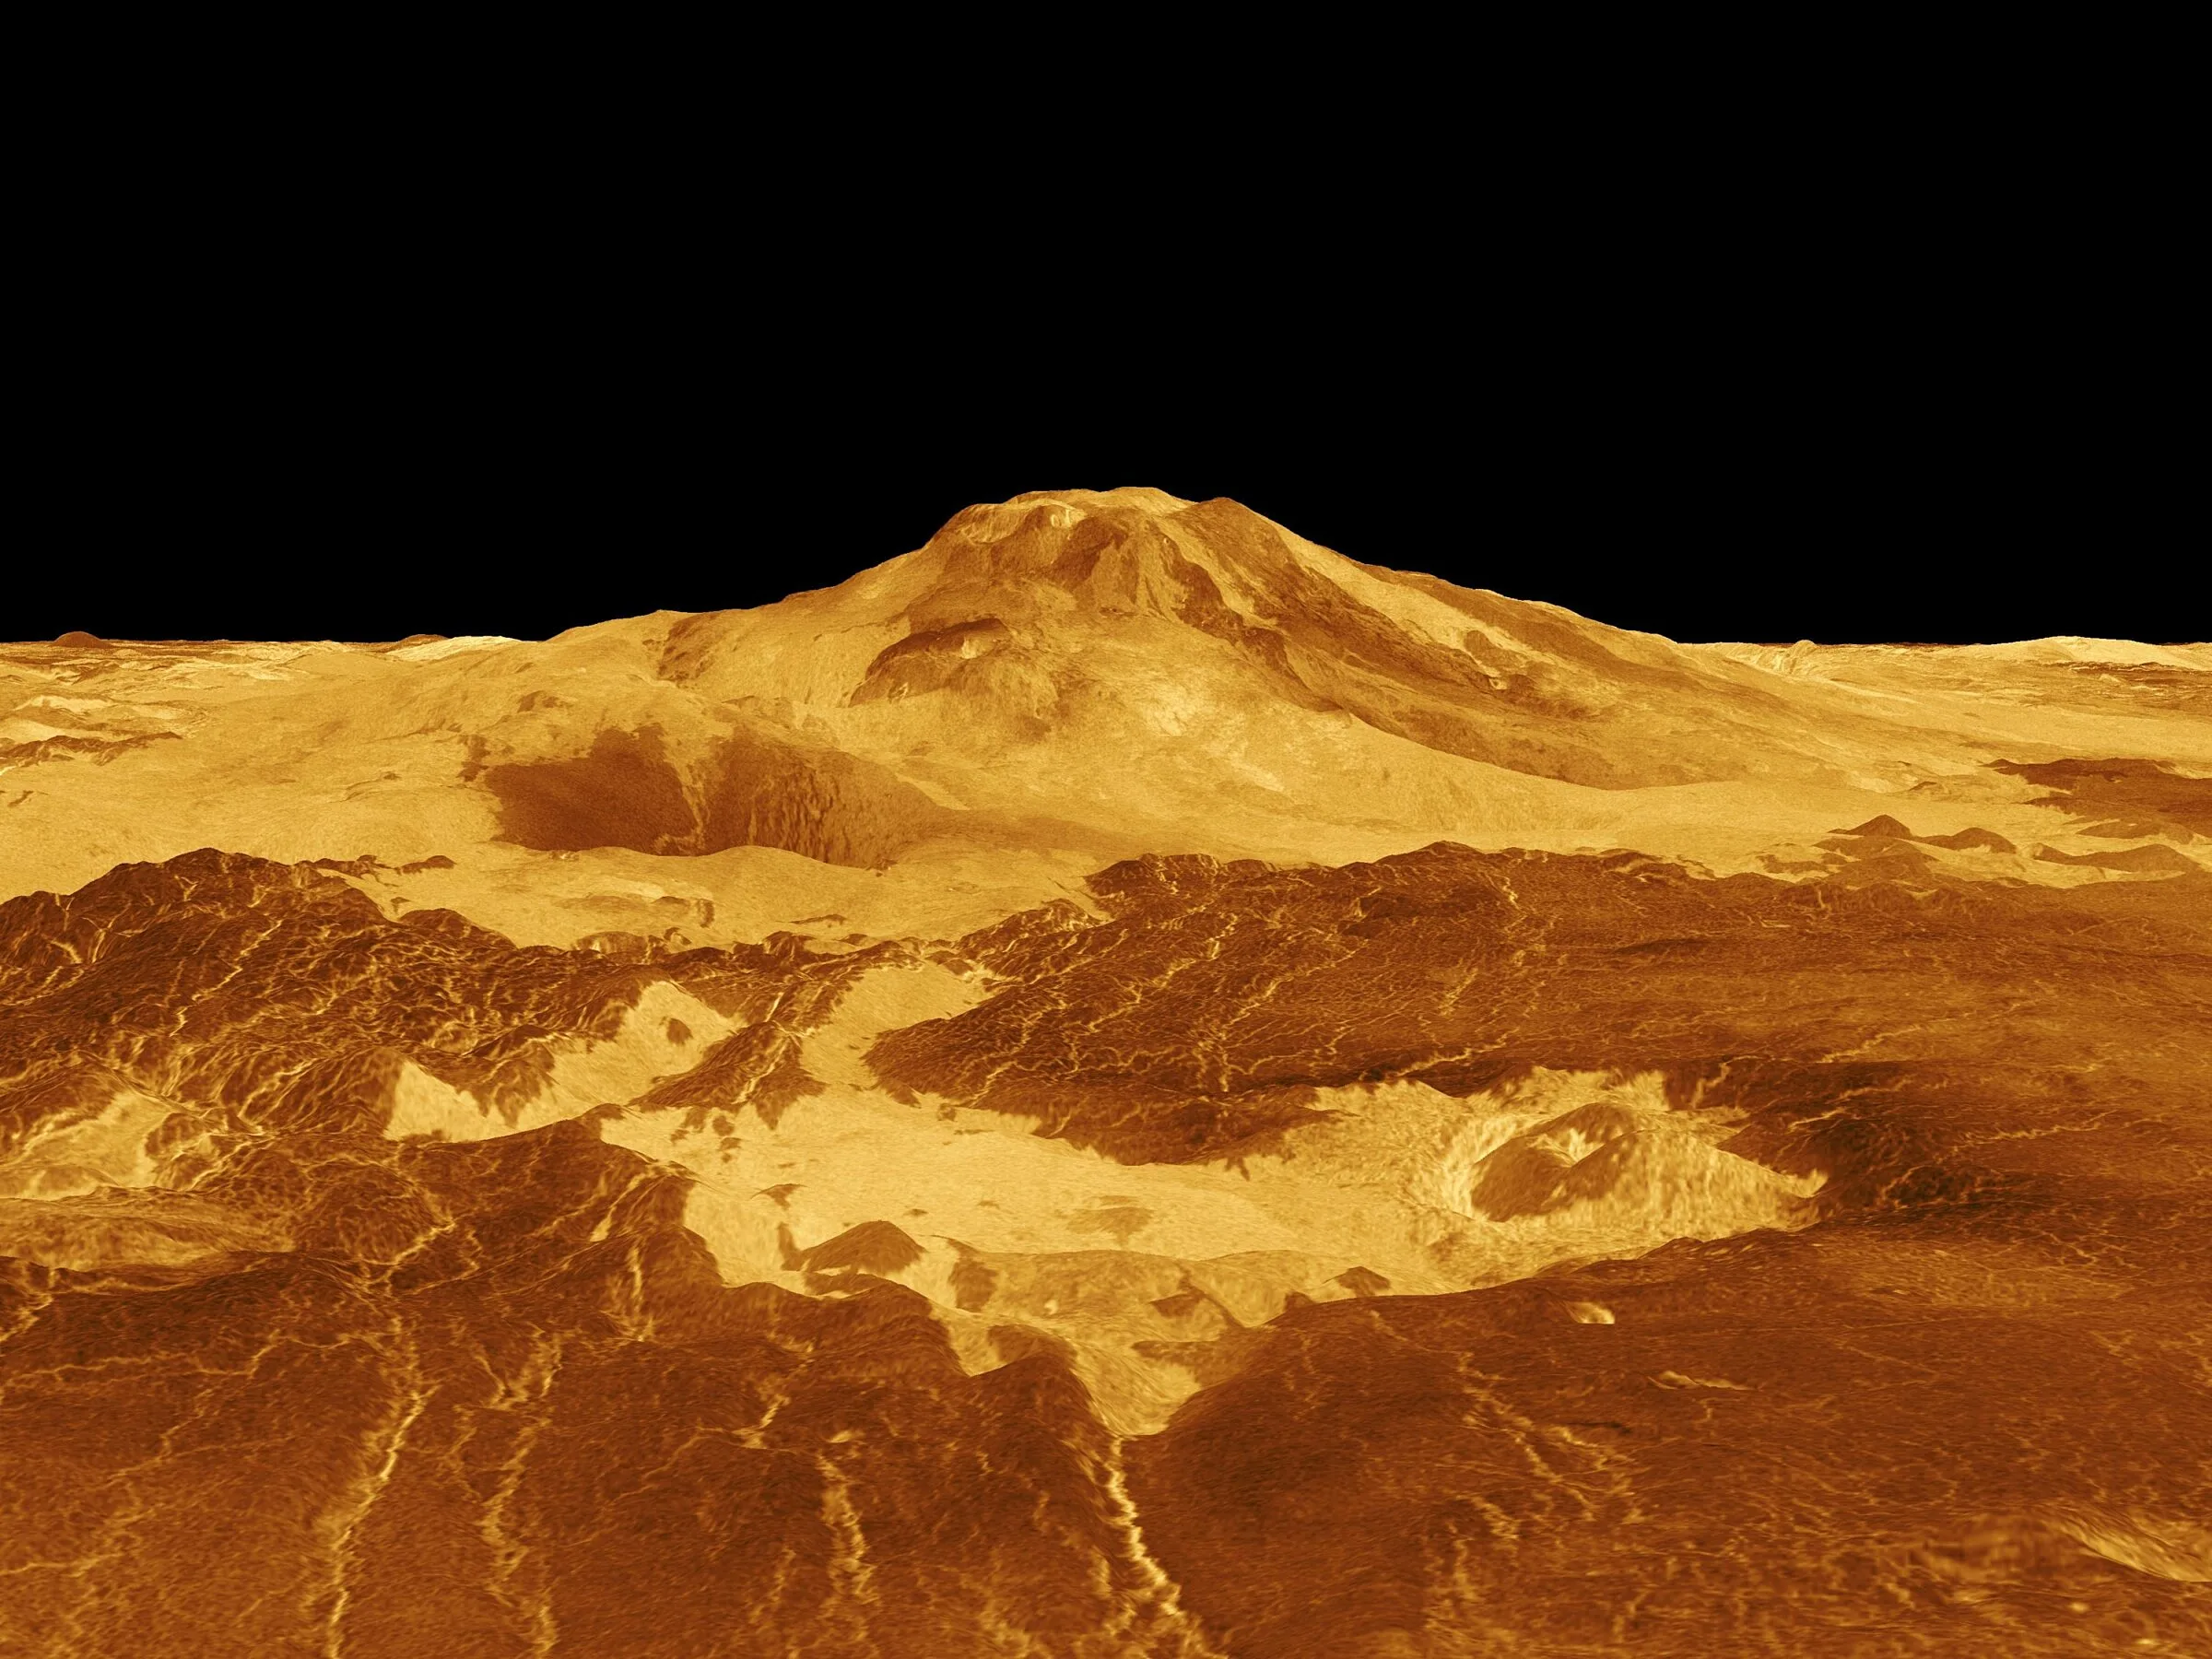
The authors finally hit paydirt north of Maat Mons, the tallest volcano on Venus. There, a circular volcanic vent with an area of 2.2 square kilometers (0.8 square miles) in February 1991 morphed by October 1991 into a vent with an area of 4.0 square kilometers (1.5 square miles).
The paper offers two explanations for what happened during those eight months. The most likely scenario is that lava flowed into the vent, changing its size and shape. Another possibility is that the vent collapsed as lava drained away elsewhere. The authors identified possible lava flows north of the vent, but due to differences in the Magellan image angles, they couldn’t rule out that the flows were already present.
MAAT MONS PERSECTIVE VIEW This 3D view of Maat Mons, the tallest volcano on Venus, was created using data from NASA’s Magellan spacecraft. The vertical scale in this perspective has been exaggerated 10 times. Maat Mons, appearing at the center, rises almost 5 kilometers (3 miles) above the surrounding terrain.Image: NASA/JPL
Future Venus exploration
The discovery that Venus is volcanically active comes amidst a continuing debate on whether phosphine, and thus possibly life, exists in the planet’s clouds. There is clearly more to explore on the planet next door.
Fortunately, four missions led by three different space agencies are headed to Venus soon: Shukrayaan, DAVINCI, VERITAS, and EnVision.
Like Magellan, VERITAS will pierce the planet’s clouds to create global radar maps. VERITAS’s maps will have a resolution of just 30 meters per pixel — a vast improvement on Magellan’s 100 to 300 meters per pixel. The spacecraft can also make topographical maps with a resolution of 250 meters in the horizontal direction, and just 5 meters in the vertical direction.
To track surface changes in extreme detail, VERITAS will use a tool called repeat-pass interferometry that compares phase differences between overlapping radar passes. This data-intensive technique can target specific areas to monitor centimeter-scale changes over hundreds of kilometers — a distinct advantage over Magellan.
“We’re planning on doing this in targeted areas, not just wherever we happen to get lucky,” said Smrekar.
Before it can study Venus, VERITAS has Earthly challenges to overcome. Last year, the mission was delayed three years to at least 2031 after a review of NASA’s Psyche mission found workforce challenges at the agency’s Jet Propulsion Laboratory. NASA’s latest budget proposal only offers a trickle of funding for VERITAS through 2028. Smrekar and other VERITAS team members are working to counteract the delay.
No one knows for sure what the next generation of Venus missions will find. Herrick noted that the new volcanic activity is comparable in scale to eruptions seen on Earth’s Hawaiian islands. Similar activity may be common across Venus, just waiting to be spotted by an orbiting spacecraft.
“We now know that these upcoming missions are going to find something,” Herrick said.
Barely three months into 2023 and we have seen a series of major banking crises unfold right before our eyes. Silicon Valley Bank collapsed, followed by Signature Bank and Credit Suisse is encountering turmoils that send panic across the market. All these on top of global economic crises, inflation, rising cost of living, major economies of the world facing strong headwinds, energy crisis, stock market instability, post-pandemic recovery, and the Ukraine War; we are indeed living in a time of polycrisis, chaos and panic.
One thing that many people believe is that there is a financial crisis happening right now. But is that really the case?
While this may seem counterintuitive to many who are grappling with the impact of the pandemic on the economy, the current situation is nothing more than a game, and one that is being played according to the rules of capitalism.
Our current state of affairs is exactly what capitalism is designed for – imbalance and inequality. Those who hold the reins of power, the “big people with big money,” are simply playing with people’s lives, and no one seems to care. The game is rigged in favour of the elite, and they will always come out on top.
This sentiment can be summed up in the Japanese concept of “Shu Ha Ri,” which describes the stages of mastery in a discipline. The first stage, “Shu” (守), is characterized by following the rules and imitating the actions of those who came before. The second stage, “Ha” (破), involves breaking the rules and developing a personal style. The final stage, “Ri” (離), is the point at which the rules are transcended, and mastery is achieved. For those who believe that there is no financial crisis, we are currently in the “Ri” stage of capitalism. The rules are being broken and transcended, and those with the power to do so are manipulating the markets to their advantage. They induce panic and fear and then buy when prices are low, reaping the rewards when the markets eventually stabilize.
A recent example of this can be seen in Credit Suisse’s recent announcement that Saudi Arabia will no longer lend to the bank. This news caused panic among investors, and the bank’s share price plummeted. This fear reverberated and major stock markets plunged; billions were wiped out in one day. Saudi Arabia, through Aramco, has already earned $161 billion profit for 2022, they can now exert their power as a purchaser which can induce panic in the market, only to buy later when the prices are low. It is a testament to the power of the purchaser, and the lengths to which people will go to maintain that power. This is exactly what capitalism is designed for, a system that thrives on imbalance and inequality.
Less than 24 hours after this news, the Switzerland Central Bank announced a $54 billion lifeline and rescue to Credit Suisse. The Swiss will never let Credit Suisse fall and its stocks went soaring once again.
Amidst the chaos and turmoil of the financial world, what does this mean for the rest of us, for those who do not have the power or money to play this game? It means that we are at the mercy of those who do and that we must find ways to survive and thrive despite the rigged system.
In the end, the financial crisis may indeed be just a game, but it is a game that has real consequences for real people. It is up to us to decide whether we will continue to be pawns in this game, or whether we will fight back and demand a more equitable and just society.
Elementary school students eagerly raise their hands as Diana Trujillo, technical group supervisor for sequence planning and execution and tactical mission lead for the Mars Perseverance rover, speaks to them on March 13, 2023.
Born and raised in Colombia, Trujillo immigrated to the U.S. at the age of 17 to pursue her dream of working for NASA. She has held several roles for NASA and JPL, including Mars Curiosity rover mission lead, deputy project system engineer, and deputy team chief of engineering operations on Curiosity.
Trujillo has also been active in sharing the excitement and opportunities of STEM with the public. She co-created and hosted #JuntosPerseveramos, NASA’s first Spanish-language live broadcast of a planetary landing, for Perseverance’s arrival on Mars, which attracted millions of viewers worldwide.
Having the most moons in our Solar System isn’t a contest, but if it were, Jupiter would be winning.
The gas giant now has 92 confirmed moons, pulling it ahead of Saturn, which has 83 known moons. Jupiter’s latest batch of 12 moons were validated in December 2022 by the International Astronomical Union’s Minor Planet Center, the global chronicler of Solar System worlds.
But the moon race is far from over. Both Jupiter and Saturn have more candidate moons awaiting final confirmation. Hunting these tiny worlds and confirming their orbits takes time. There’s more than just bragging rights at stake: Outer planet moons have much to teach us about how the giant planets formed, and what conditions were like in the Solar System’s early days.
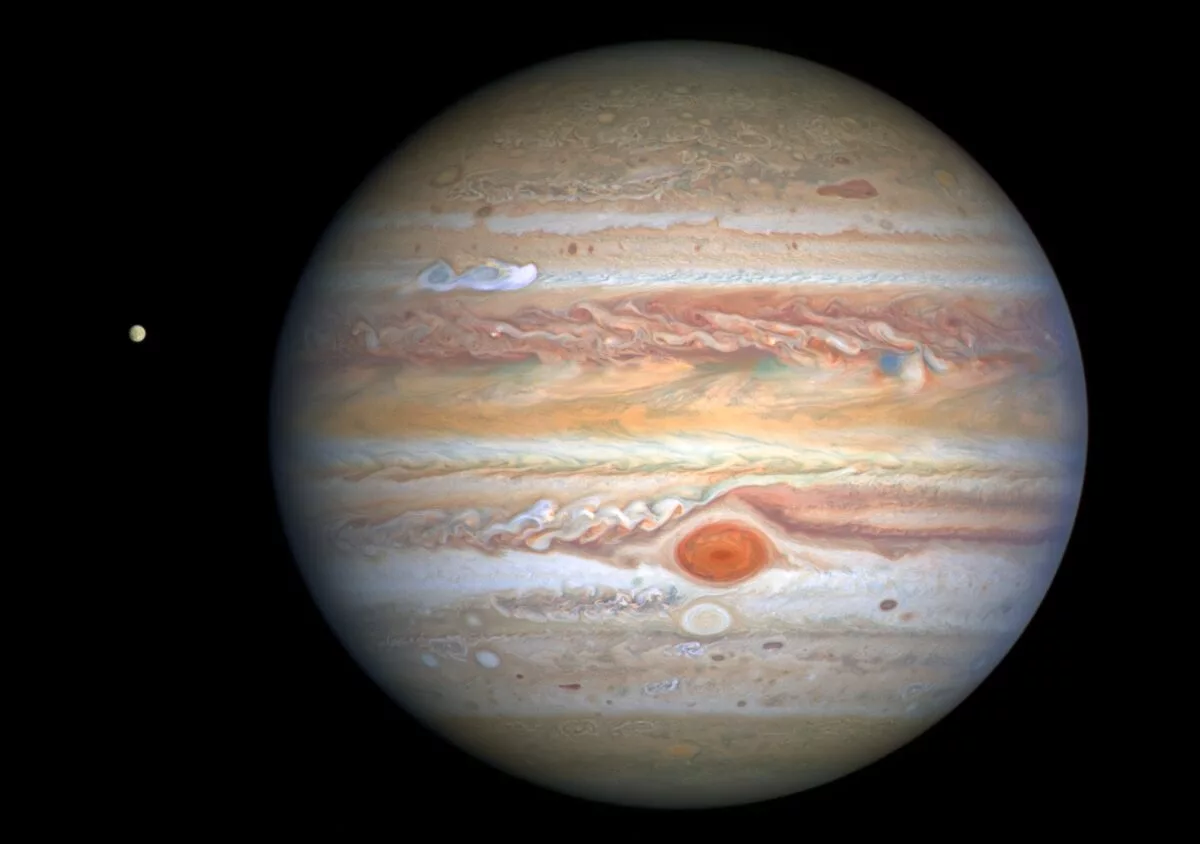
HUBBLE SPACE TELESCOPE PICTURE OF JUPITER, 2020 NASA’s Hubble Space Telescope captured this image of Jupiter and its moon Europa in August 2020. Jupiter’s newly discovered outer moons are comparatively small, with distant, atypical orbits.Image: NASA, ESA, STScI, A. Simon (Goddard Space Flight Center), M.H. Wong (University of California, Berkeley), and the OPAL team / Edited by The Planetary Society
Meet Jupiter’s new moons
Jupiter’s new moons are not as large and flashy as the Galilean moons Io, Europa, Ganymede, and Callisto. They are instead members of the planet’s irregular satellites — comparatively small outer moons with distant, atypical orbits. Some are no wider than a kilometer.
Jupiter’s outer moons fall into two categories: prograde moons, which orbit closer to Jupiter and in the same direction as the planet’s rotation, and retrograde moons, which orbit farther from Jupiter and in the opposite direction as the planet’s rotation.
Most of these outer moons formed from collisions that chipped small fragments off of larger parent moons in the same orbit. The parent bodies of the prograde moons likely formed in place with Jupiter. That means they may contain the recipe of elements that formed the gas giant billions of years ago.
The parent bodies of the retrograde moons were likely free-flying worlds, possibly from the primitive Kuiper Belt, captured by Jupiter’s gravity long ago. That means they could be examples of small worlds from the planet’s original neighborhood.
How Jupiter captured these moons is a mystery. Just like a spacecraft approaching a planet, a moon must slow down to enter orbit. While a spacecraft uses thrusters, small moons entering Jupiter’s orbit could have relied on timely encounters with an ice giant or drag from gas left over from the planet’s formation.
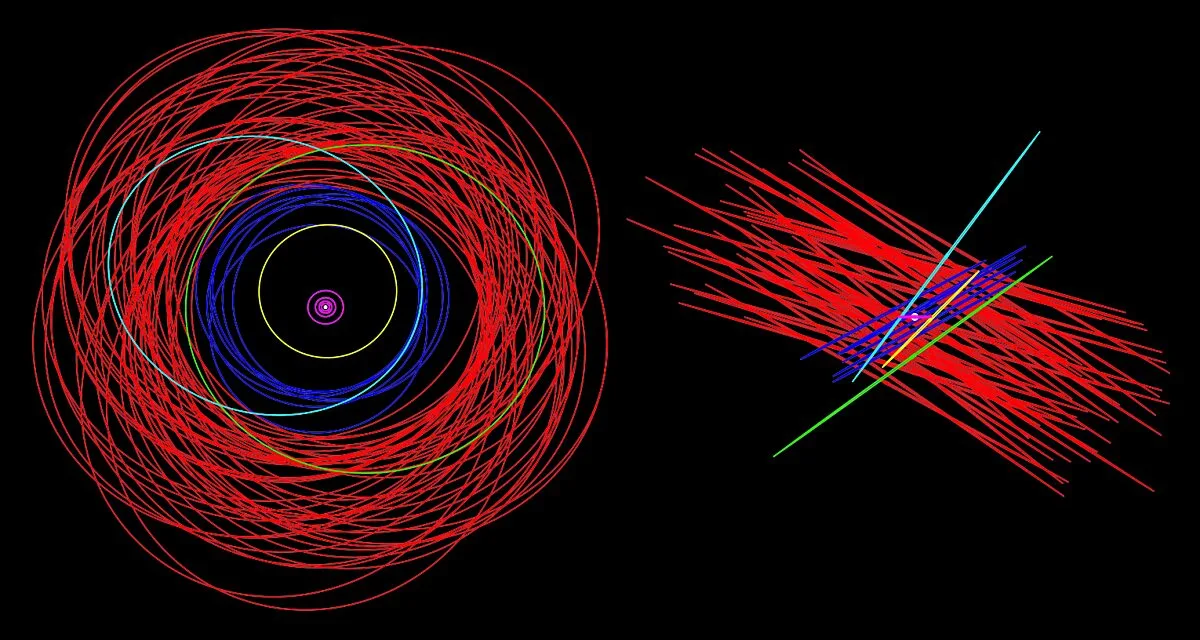
THE ORBITS OF JUPITER’S MOONS Two views of the orbits of Jupiter’s known moons: top-down (left) and horizontal with Jupiter’s equatorial plane (right). The innermost Galilean moons are pink, while the outermost retrograde moons are red. The other orbits represent prograde moons.Image: Scott Sheppard
Right location, right time
The scientists that found the 12 new moons of Jupiter weren’t looking for them at all, in a manner of speaking.
Scott Sheppard, a faculty member at the Carnegie Institution for Science, Earth and Planets Laboratory in Washington, D.C., is part of a team looking for dwarf planets beyond Pluto. The search was conducted using the Subaru Telescope on Maunakea, Hawaiʻi, and the Víctor M. Blanco Telescope at the Cerro Tololo Inter-American Observatory in Chile. These powerful telescopes have instruments that allow them to survey the sky relatively quickly, looking for dim specks moving in the darkness.
Occasionally, the portion of sky being surveyed crosses paths with Jupiter or Saturn. When that happens, the team aims for the region of space right next to the planet, to see if they can pick up any bonus moons.
“At some point during the year, the planets will be at the right location at the right time,” said Sheppard.
A new point of light moving near Jupiter does not automatically get awarded moon status. The candidate moon has to be re-observed weeks, months, and even years after its initial discovery, until its orbit is known with certainty.
For that, the team turns to the Magellan Telescopes at the Las Campanas Observatory in Chile. But even with a 6.5-meter (21-feet) diameter mirror enlisted for the hunt, tracking small moons next to Jupiter’s glare is a challenge. Some moons disappear until their orbits carry them to a more favorable viewing location.
“But by that time, you might not have a precise enough moon orbit known, and thus are not able to easily find them again,” Sheppard said.
Both Jupiter and Saturn have candidate moons that are discovered and cataloged, but not formally recognized. Only after a year of observations will the Minor Planet Center recognize them, and only objects wider than a kilometer will get names. Sheppard said about half of the new moons are big enough to get names.
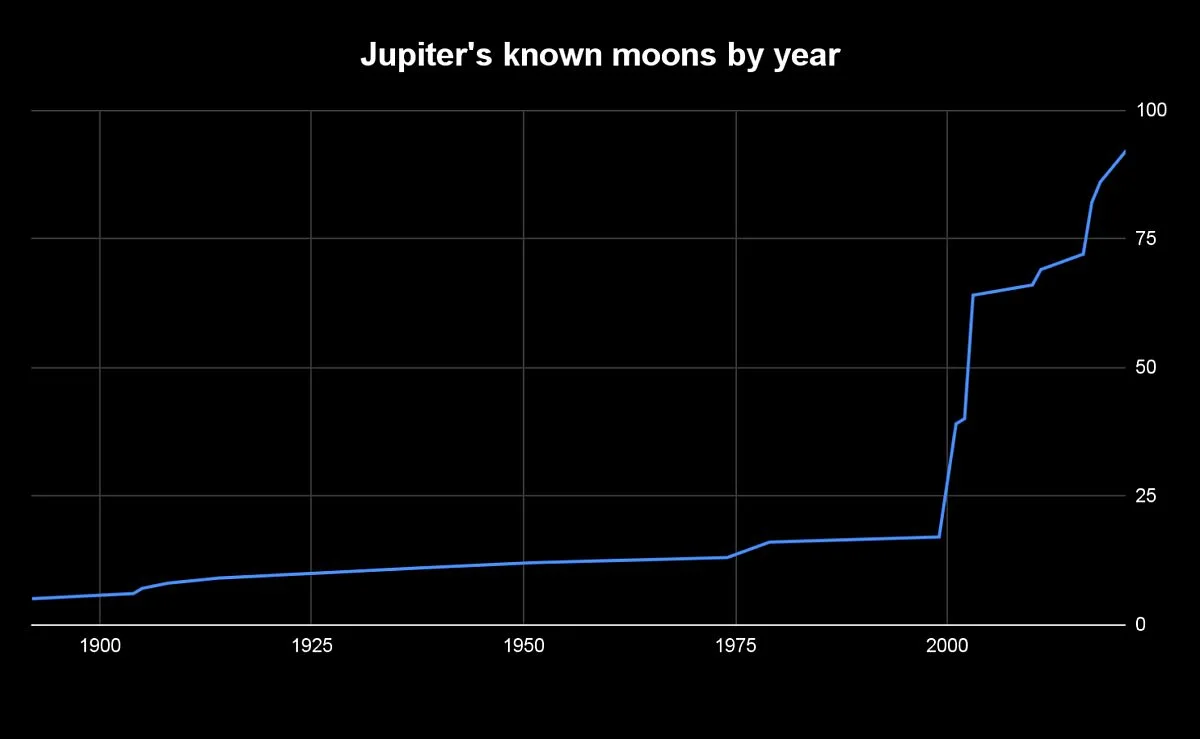
JUPITER’S KNOWN MOONS BY YEAR The number of Jovian moons has quintupled since the year 2000, when digital imaging technology started being applied to large telescopes. Discoveries leapt forward again following the advent of wide-field survey telescopes able to image portions of the sky more than 10 times larger than Earth’s moon.Image: Data by Scott Sheppard, visualization by Jason Davis
An outer moon flyby?
Many scientists would love to get an up-close look at one of Jupiter’s outer moons. Two new spacecraft will arrive at the planet in the coming years: NASA’s Europa Clipper in 2030, and the European Space Agency’s JUICE one year later.
Both spacecraft must be injected into precise orbits that will allow them to study Jupiter’s inner moons. The only opportunity to visit an outer moon could come as the probes enter the system.
Bonnie Buratti, the deputy project scientist for Europa Clipper, said that her team was conducting an analysis to see if Clipper’s inbound trajectory could be nudged to send it past an outer moon. So far, they have not found a flyby opportunity closer than a million kilometers (620,000 miles) — more than twice the distance between the Earth and the Moon.
“I doubt we will get close to any of them, or even be able to “see” them with any instrument,” she said. “The problem is: To get closer, we would have to expend precious spacecraft fuel and redesign the tour. Would that be worth the time, money, and resources, and having to give up one or more Europa flybys? Unlikely.”
The JUICE team performed a similar analysis two years ago and could not find a flyby opportunity, said Olivier Witasse, head of ESA’s Solar System section. The team is reconsidering that assessment following the discovery of the new moons, and adjustments to JUICE’s trajectory.
“With the discovery of new moons, the new trajectory and the assessment of the launch performances, we will redo the analysis after launch to check the situation,” he said. “If we find a good opportunity and we have enough propellant, we may take the decision to do it.”
In the meantime, outer moon work will stay in the realm of telescopes. In addition to searching for moons at Jupiter and Saturn, Sheppard said his team also has a separate project looking for new moons around Uranus and Neptune.
“We just sit on those planets for long periods of time to try and find very faint things,” he said. “So that’s something that we’re working on right now.”
All four of the outer planets likely have more moons awaiting discovery. Just like the early Solar System, each planet’s number of moons is dynamic and subject to change.
The Biden Administration proposed $27.2 billion for NASA’s 2024 fiscal year. If approved by Congress, this would represent a 7% increase over 2023 levels. The budget would grow funding for NASA’s Artemis lunar exploration program, Mars Sample Return, Earth Science, and technology research and development.
The President’s Budget Request
2023 Enacted
2024 PBR
% Change
NASA
$25,384
$27,185
+7.1%
Science
$7,795
$8,261
+%6
↳ Planetary Science
$3,200
$3,383
+%5.7
↳ Earth Science
$2,195
$2,473
+12.7%
↳ Astrophysics
$1,510
$1,557
+3%
↳ Heliophysics
$805
$751
-6.7%
↳ Biological & Physical Science
$85
$97
+%13.5
Exploration
$7,469
$7,971
+6.7%
↳ Orion Crew Vehicle
$1,339
$1,225
-8.5%
↳ SLS
$2,600
$2,506
-3.6%
↳ Human Landing System
$1,486
$1,881
+27%
Space Technology
$1,200
$1,392
+16%
Space Operations
$4,250
$4,535
+6.7%
↳ Commercial LEO Development
$224
$228
+1.8%
Aeronautics
$935
$996
+6.5%
STEM Engagement
$143.5
$157.8
+10%
Safety, Security, & Mission Services
$3,130
$3,369
+7.7%
Construction and Environmental Compliance
$414.3
$454
+9.5%
NASA Inspector General
$47.6
$50.2
+5.5%
All values are in millions of dollars. Directorate/top-level line-items are in boldface, divisions and major projects are in standard formatting; sub-programs are in italics. All major directorates are listed. Only selected divisions and projects are included. For further detail see the FY 2024 NASA Budget Request.
Explore this data. View historical NASA budget data, including breakdowns by fiscal year, and comparisons to total U.S. spending and GDP, on this Google Spreadsheet.